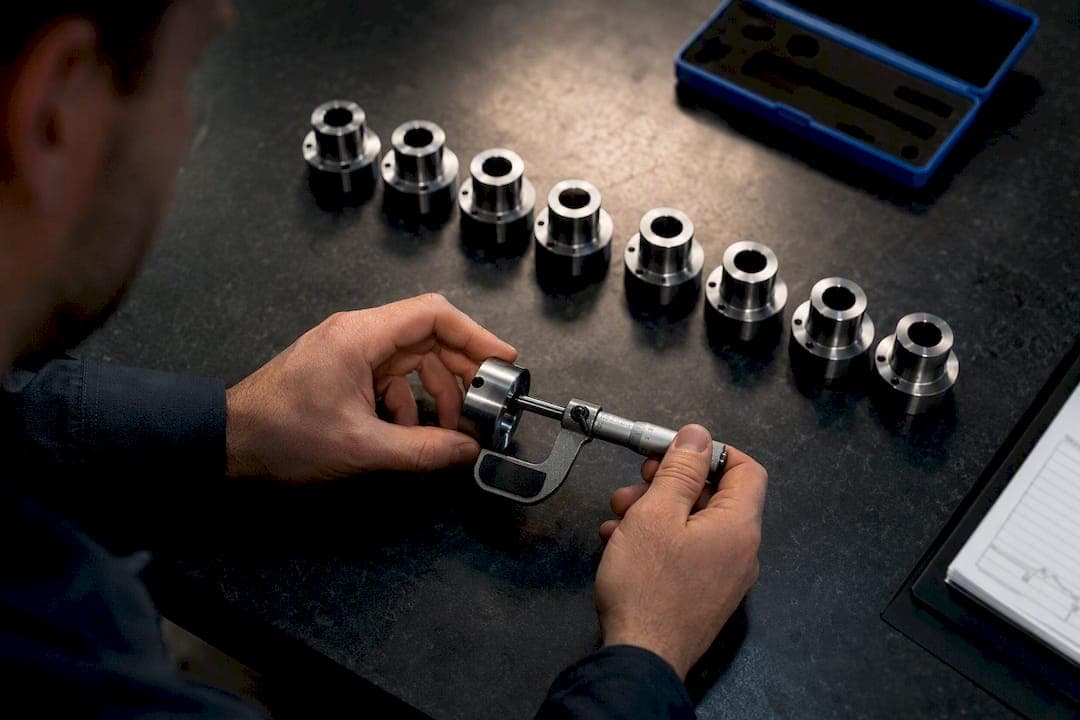
Gage R&R is a measurement-system study that separates real part-to-part variation from noise introduced by your gauge and the people running it. Run one whenever you bring in a new gauge or inspect a new feature, before you submit a PPAP package, or any time you suspect your SPC data is lying to you. As a quick rule of thumb, AIAG guidance treats %GRR under 10% as acceptable, 10 to 30% as conditional, and anything above 30% as unacceptable, but check the number of distinct categories before you trust any of it.
TL;DR:
- Gage R&R studies should be run with parts spanning the entire tolerance range and three operators to produce valid, trustworthy results.
- Industry guidance considers a %GRR under 10% acceptable, with a minimum of five distinct categories (ndc) for study validity.
- ANOVA analysis is preferred over Xbar/R when operator–part interaction may exist or for PPAP documentation, due to its ability to detect these effects.
- High measurement variability from equipment or operators can lead to false rejections or masking of defects, undermining SPC and capability indices.
- Regular rechecks after gauge changes, fixture redesigns, or operator turnover improve the usefulness and compliance of the measurement system.
Table of Contents
- What Gage R&R Measures on the Shop Floor
- Why This Matters for SPC and PPAP Approval
- How to Run a Crossed Type II Gage R&R Study
- Xbar/R vs ANOVA: Choosing the Right Analysis Method
- Reading the Report: %GRR, %Tolerance, and ndc
- Fixing the Root Cause: EV, AV, or Interaction
- Linking Gage R&R to PPAP and CNC Production Release
- Where Availzye Machinist Pro Fits Into MSA Work
- A Quality Manager's Take on Making GR&R Actually Useful
- Simplify Data Capture Without Cutting Corners on Rigor
- Sources
What Gage R&R Measures on the Shop Floor
Every measurement you take contains three sources of variation: repeatability (the same operator, same part, same gauge, different readings), reproducibility (different operators disagreeing on the same part), and part-to-part variation, which is the variation you actually want to see. Gage R&R analysis exists to pull those three apart so you know whether your inspection data reflects the parts or the process of measuring them.
Machinists typically choose from three study designs:
- Crossed studies put every operator on every part, which is standard for dimensional CNC features measured with calipers, micrometers, or CMMs.
- Nested studies fit destructive testing, where each part gets measured once and can't be reused across operators.
- Expanded studies add extra factors, like multiple fixtures or gauge instruments, when you need to isolate more than operator and part.
Most machining studies use multiple parts, several operators, and multiple trials per part, selecting quantities that adequately span the tolerance range to produce meaningful results. That sample size is what makes the number of distinct categories (ndc) meaningful, and AIAG guidance wants ndc at 5 or higher before you trust the result.
Why This Matters for SPC and PPAP Approval
A gauge that consumes a significant portion of your tolerance band risks producing false rejects on good parts or passing bad parts by masking actual defects. Such measurement noise undermines SPC charts and capability indices because these assume trustworthy inspection data.
By the Numbers: AIAG and industry consensus put the acceptable ceiling at 10% GRR relative to tolerance, with a conditional zone up to 30% and rejection above it, and a separate requirement that ndc reach at least 5 for the study itself to be considered valid.
OEM buyers in automotive and aerospace routinely require an MSA study as part of PPAP Element 4, and many specifically ask for ANOVA output rather than the simpler Average and Range method because ANOVA catches operator×part interaction that Xbar/R can miss entirely. Skip the study or fudge it, and you're looking at scrap costs, rework loops, and an auditor who now wants to reopen your entire PPAP file.
How to Run a Crossed Type II Gage R&R Study
A valid study comes down to disciplined part selection and disciplined data capture. Here's the sequence that produces defensible numbers instead of a report nobody trusts.
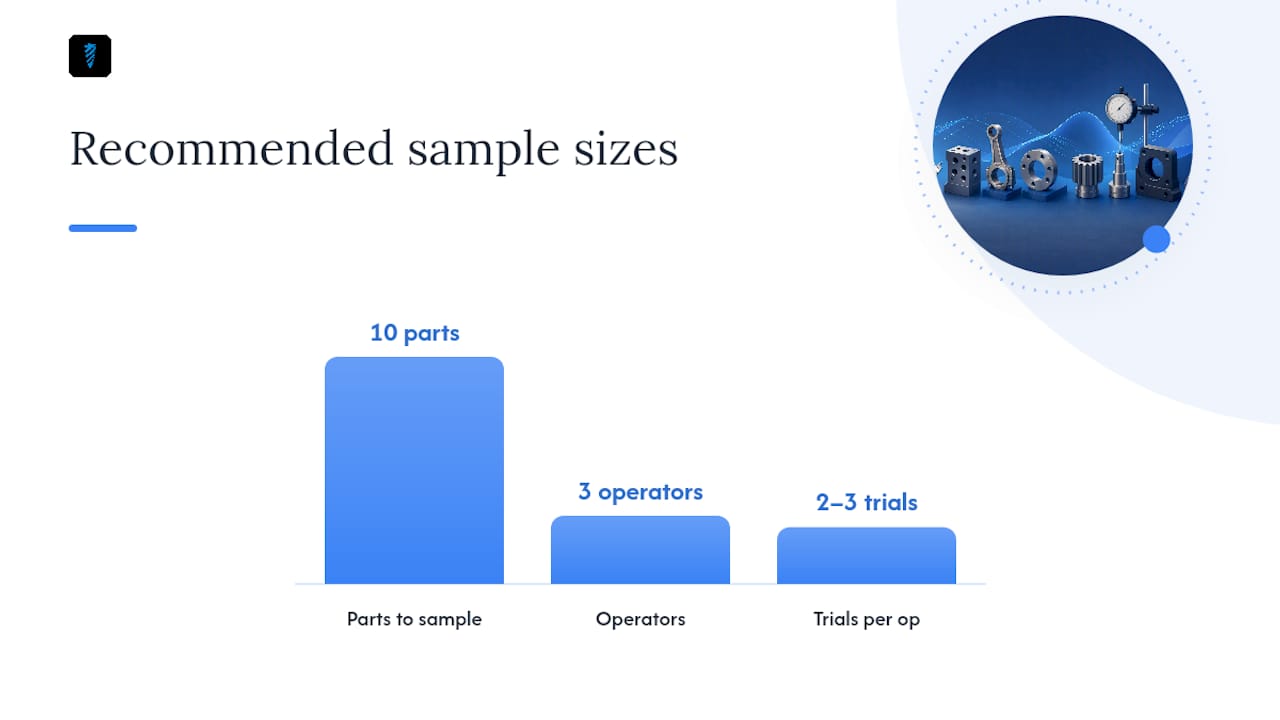
- Select 10 parts spanning the full tolerance range, not 10 parts clustered near nominal. Picking parts that don't span tolerance is the single most common reason a study reports a deceptively low %GRR.
- Choose three operators who normally run this inspection, not your best inspector three times over.
- Label parts with codes the operators can't decode, so nobody knows they're remeasuring part 7 versus a fresh one.
- Randomize the measurement order for each trial and each operator, and physically shuffle the parts between rounds.
- Run two to three trials per operator per part, recording every reading directly into your MSA worksheet as you go, not from memory at the end of the shift.
- Control the measurement environment, meaning consistent temperature, consistent fixturing, and the same gauge for the entire study.
- Check gauge resolution before you start. A gauge with resolution worse than one-tenth of the tolerance band will distort results no matter how carefully you run the study.
Pro Tip: Keep operators physically separated during the study and ban shop-floor chatter about "which one felt tight." A single comment like that biases the next reading and quietly ruins reproducibility data.
The step-by-step protocol FRIMA outlines for CNC inspection walks through this same blinding and randomization logic, and it's worth following closely if this study is headed into a PPAP submission.
Xbar/R vs ANOVA: Choosing the Right Analysis Method
The Average and Range method has been the shop-floor default for decades because you can run it with a calculator and a set of range tables. It computes %GRR from average ranges across operators and trials, and for a quick internal check on a stable process, it's fast enough to be genuinely useful.
The catch: Xbar/R can't detect operator×part interaction, meaning it may miss cases where Operator A reads high on small parts but low on large ones. ANOVA partitions that interaction explicitly, breaking variance into equipment, operator, part, and the interaction term separately. That's exactly why most OEMs asking for PPAP documentation want ANOVA output, not Xbar/R.
Software options for either method include:
- Minitab, which produces the crossed Gage R&R example most quality departments train on.
- R's gageRR package, which gives you the same variance-component breakdown for teams already working in a scripting environment.
- Excel templates built around the AIAG worksheet format, adequate for Xbar/R but clumsy for full ANOVA output.
Run ANOVA whenever you suspect interaction or you're feeding a PPAP package. Xbar/R is fine for a fast health check between formal studies.
Reading the Report: %GRR, %Tolerance, and ndc
A useful MSA report answers three separate questions, and conflating them is a common mistake.
- %GRR relative to total study variation tells you how much of the observed spread comes from measurement error versus real part differences.
- %GRR relative to tolerance tells you whether that error matters given how tight your spec actually is. A gauge can fail one comparison and pass the other.
- Number of distinct categories (ndc) tells you whether the study itself had enough resolving power to trust either number.
By the Numbers: Industry guidance treats ndc below 5 as a red flag regardless of how good the %GRR number looks, since small sample sizes make the variance-component math unreliable.
It's a study that needs better part selection and a rerun before anyone signs off on it. Don't let a flattering percentage talk you out of checking the category count.
Fixing the Root Cause: EV, AV, or Interaction
The corrective action depends entirely on which variance component is driving the failure, and treating all three the same way wastes time.
- High equipment variation (EV) points to the gauge itself. Replace it, improve fixturing, or control ambient temperature and vibration near the inspection station.
- High appraiser variation (AV) points to people, not hardware. Standardize the work instruction, retrain on grip and alignment technique, or switch to a measurement method that requires less operator judgment.
- High operator×part interaction is the trickiest fix. It usually means retraining on specific feature types, changing probe or contact strategy, or redesigning the fixture so the part can only be measured one correct way.
Pull the variance components apart first.
Linking Gage R&R to PPAP and CNC Production Release
PPAP Element 4 expects an MSA package, not just a pass/fail statement. Attach the completed worksheet, the %GRR summary table, the ndc value, and the operator comparison charts your software generated.
- Run the initial Gage R&R during first-article inspection, before capability studies lock in your process baseline.
- Rerun it after any gauge replacement, fixture redesign, or operator turnover on that inspection station.
- A typical sequence looks like: first-part measurement → Gage R&R study → capability study using the validated gauge → PPAP submission → production release with a scheduled recheck cadence.
Keeping that paper trail organized matters as much as running the study correctly. A tolerance calculator helps confirm you selected parts spanning the actual tolerance band before you start.
Where Availzye Machinist Pro Fits Into MSA Work
Availzye Machinist Pro doesn't replace the statistics, but it removes the sloppy data entry that quietly invalidates studies. The Tool Crib tracks gauge inventory and calibration status so you're not running a study with an out-of-cal micrometer, and the Job Tracker schedules recurring MSA checks alongside normal work orders. Centralizing those records means your next audit pulls from one place instead of three notebooks and a shared drive.

A Quality Manager's Take on Making GR&R Actually Useful
The compliance box gets checked either way. What separates a useful measurement system from a paperwork exercise is cadence: short rechecks after any fixture or process change, operator input on which gauges feel unreliable, and using the variance breakdown to prioritize fixes instead of filing the report and moving on.
— Availzye
Simplify Data Capture Without Cutting Corners on Rigor
This software solution offers an alternative to juggling loose spreadsheets and paper worksheets for shops running Gage R&R studies alongside daily production. It won't run your ANOVA for you, but it helps keep inputs clean by centralizing gauge status, part records, and job scheduling.

The Tool Crib flags gauges due for calibration before they end up in a study by accident, and the Job Tracker schedules your recheck cadence right next to the work orders it affects. If your shop is prepping for a PPAP submission or just tired of chasing down which micrometer was actually used last Tuesday, start a free trial and see how the calculators and tool tracking fit your existing MSA workflow.
Sources
- Gage R&R Overview & Example - Statistics By Jim
- Gage R&R (ASQ / Quality resources)
- Gauge R&R Study for CNC Inspection: How to Validate Your Measurement System Before PPAP - FRIMA