
Machine utilization (%) = (Actual production hours ÷ Available hours) × 100. That single formula tells you what share of scheduled time a machine is actually running and producing parts. A result of 75% means one quarter of your scheduled capacity is sitting idle, whether from downtime, changeovers, or gaps between jobs. The number is only as reliable as the denominator you choose, so define "Available hours" explicitly and keep that definition consistent across every machine and every reporting period.
Pro Tip: Write your denominator definition on the report itself, not just in a spreadsheet tab. When two people pull different utilization numbers for the same machine, the denominator is almost always the culprit.
Table of Contents
- What does machine utilization actually measure?
- The core machine utilization calculation and its variants
- How to calculate available hours correctly
- Step-by-step worked examples
- How to capture the data you need
- How Availzyemachinistpro supports utilization tracking
- What is a good utilization rate?
- How to improve utilization without just running the machine more
- Common calculation mistakes that produce misleading numbers
- How to calculate machine utilization in Excel
- Key Takeaways
- The number that actually tells you something
- Availzyemachinistpro turns utilization data into daily decisions
- Useful sources and further reading
What does machine utilization actually measure?
Machine utilization is a runtime share metric. It answers one question: of the time this machine was scheduled to run, how much of it was actually spent producing parts? That is narrower than it sounds.
Actual production hours (also called run time or operating time) covers only the time the machine is actively cutting, pressing, forming, or otherwise processing parts. It excludes:
- Unplanned breakdowns and repair time
- Changeover and setup time (unless you deliberately include it as a variant)
- Waiting for material, operators, or programs
- Quality holds and inspection delays
Available hours (scheduled time) is the denominator, and it has three common bases:
- Calendar hours: 24 × 365 = 8,760 hrs/year. Used for TEEP calculations; rarely used for day-to-day utilization.
- Scheduled shift hours: the hours the machine is actually staffed and planned to run. This is the most common base for shop-floor reporting.
- Net planned production time: scheduled hours minus planned stops like shift breaks, planned maintenance windows, and holidays. This is the tightest and most defensible base.
Utilization is not the same as OEE (Overall Equipment Effectiveness). As the OEE framework defines it, OEE multiplies Availability × Performance × Quality, so it captures whether the machine is making good parts at full speed. Utilization only captures whether the machine is running at all.
TEEP (Total Effective Equipment Performance) goes further still, measuring OEE against calendar time rather than scheduled time. It exposes how much capacity is lost to scheduling decisions, not just shop-floor losses.
The core machine utilization calculation and its variants
Standard time-based formula
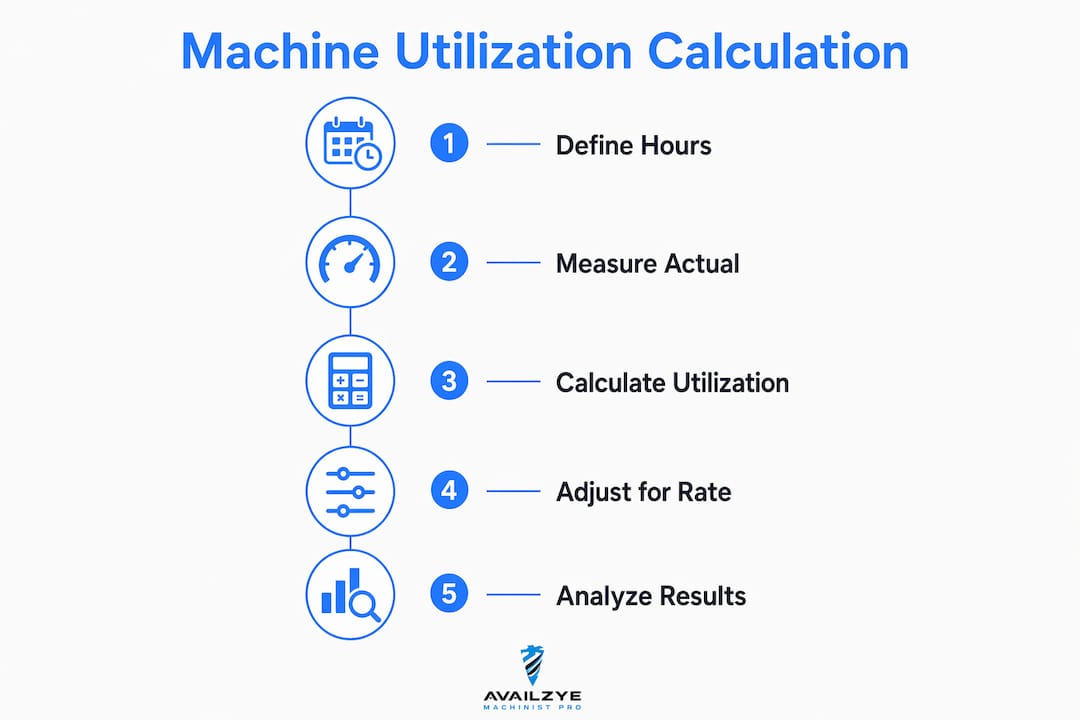
Utilization (%) = (Actual production hours ÷ Available hours) × 100

This is the canonical formula used across U.S. manufacturing. A machine scheduled for 24 hours that runs for 18 hours yields 75% utilization: (18 ÷ 24) × 100 = 75%.
Unit-based (part-output) variant
When you track parts produced rather than runtime directly, convert output to equivalent hours:
Required capacity (hrs) = Σ (Part qty × Cycle time) ÷ OEE factor
Include setup time and secondary operations in that sum. This approach is useful for capacity planning when you need to compare required hours against available hours across a mix of part numbers.
TEEP vs. utilization
| Metric | Denominator | What it exposes |
|---|---|---|
| Utilization | Scheduled shift hours | Share of planned time the machine ran |
| OEE | Scheduled shift hours | Productive share (availability × speed × quality) |
| TEEP | Calendar hours (8,760/yr) | Total capacity gap including scheduling losses |
Use utilization for day-to-day shift reporting. Use TEEP when you are evaluating whether to add a shift or buy a machine, because it shows how much calendar capacity is being left on the table by scheduling decisions alone.
Engineered-rate adjustments
When converting parts to hours, add an allowance factor of 1–15% for micro-stoppages and small delays that do not appear in formal downtime logs. Document the allowance method so the metric stays auditable across reporting periods.
Pro Tip: Label your denominator explicitly on every report, for example "Net available hours (scheduled shifts minus planned breaks)." Denominator blindness is the single most common reason two managers pull different utilization numbers for the same machine on the same day.
How to calculate available hours correctly
Getting the denominator right is where most shops go wrong. Here is how to build a defensible Available Hours figure.
Choosing your base
- Start with scheduled shift hours for the reporting period (week, month, or year).
- Subtract planned maintenance windows that are pre-scheduled and non-negotiable.
- Subtract holidays and planned shutdowns from the plant calendar.
- Subtract shift breaks if your shop excludes them from production time.
- Add a reserve buffer for high-mix, make-to-order shops: typically 10–15% of net planned time held back for unplanned variability.
Shift-based annual hour benchmarks
| Shift model | Calculation basis | Approximate annual hours |
|---|---|---|
| 1 shift | 8 hrs × 250 working days | ~2,000 hrs/year |
| 2 shifts | 16 hrs × 250 working days | ~4,000 hrs/year |
| 3 shifts (24/7) | 24 hrs × 365 days | ~8,760 hrs/year |
These figures come from standard shift-hour references and are a useful starting point before you subtract holidays and planned downtime.
Worked mini-examples
1-shift shop (monthly):
- Scheduled: 8 hrs/day × 22 working days = 176 hrs
- Subtract planned PM: 4 hrs
- Subtract holidays: 0 (none this month)
- Net available hours: 172 hrs
2-shift shop (monthly):
- Scheduled: 16 hrs/day × 22 days = 352 hrs
- Subtract planned PM (both shifts): 8 hrs
- Net available hours: 344 hrs
3-shift shop (monthly):
- Scheduled: 24 hrs/day × 22 days = 528 hrs
- Subtract planned PM and weekend shutdowns: 24 hrs
- Net available hours: 504 hrs
For stable, high-volume lines, a smaller reserve buffer (5%) is appropriate. For high-mix job shops with frequent changeovers and custom setups, hold back 15% to avoid committing capacity you cannot reliably deliver.
Step-by-step worked examples
CNC job-shop example
A three-axis machining center runs one shift, five days a week.
- Available hours (monthly): 8 hrs/day × 22 days = 176 hrs; subtract 4 hrs planned PM = 172 hrs net available
- Actual run hours logged: 131 hrs (from shift logs)
- Utilization: (131 ÷ 172) × 100 = 76.2%
- Lost hours: 172 − 131 = 41 hrs
Digging into those 41 hours reveals 18 hrs of changeover, 14 hrs of material wait, and 9 hrs of unplanned breakdown. That breakdown tells you exactly where to focus: changeover reduction and material flow, not just "run the machine more."
High-volume press example (unit-based)
A stamping press runs two shifts. The standard cycle time is 0.02 hrs per part (72 seconds). Last month it produced 14,500 good parts.
- Equivalent production hours: 14,500 × 0.02 = 290 hrs
- Available hours: 16 hrs/day × 22 days − 8 hrs PM = 344 hrs
- Utilization: (290 ÷ 344) × 100 = 84.3%
That sits comfortably in the target range. If the press had produced 12,000 parts instead, utilization would drop to 69.8%, which is a signal worth investigating before the next scheduling cycle.
Pre-calculation checklist
Before you run any utilization number, verify these items:
- Timestamps are from the machine or shift log, not estimated after the fact
- Planned stops (breaks, PM, holidays) are subtracted from Available hours, not from Actual hours
- Scrap and rework time is excluded from Actual production hours unless you are tracking it separately
- Setup and changeover time is categorized consistently (either always in or always out)
- Part counts use good parts only, not total parts produced
Pro Tip: Run a 10-minute data audit at the start of each month before computing utilization. Catching a miscategorized downtime code now is far cheaper than defending a wrong number in a capacity review.
How to capture the data you need
Three practical capture strategies
Manual shift logs are the starting point for most shops. Operators record start time, stop time, and downtime reason on a paper or digital form at the end of each shift. Low cost, but accuracy depends on operator discipline and the quality of your reason codes.

Semi-automated Excel with timestamps adds a layer of structure. Operators enter timestamps into a shared spreadsheet; formulas compute run time automatically. This cuts arithmetic errors and makes it easier to spot missing entries.
Automated machine monitoring via PLC or MES captures runtime signals directly from the machine controller. No operator entry required for runtime data, though reason codes still need human input. This is the most accurate method and the one that scales to multi-machine shops.
Essential data fields
Every utilization record needs at minimum:
- Machine ID and work center
- Scheduled start and finish time (from the production schedule)
- Actual runtime start and stop timestamps
- Downtime reason codes (breakdown, changeover, material wait, planned PM, etc.)
- Part number and quantity produced
- Standard cycle time (for unit-based conversion)
Capture method comparison
| Method | Setup effort | Accuracy | Scalability | Best for |
|---|---|---|---|---|
| Manual shift logs | Low | Moderate | Low | 1–5 machines |
| Excel with timestamps | Low–Medium | Good | Medium | 5–20 machines |
| PLC/MES monitoring | High | High | High | 20+ machines |
For shops with fewer than five machines, a well-designed Excel log with consistent reason codes gets you 90% of the value at a fraction of the cost. The Job Tracker in Availzyemachinistpro bridges the gap between manual logs and full MES by capturing scheduled vs. actual time per work order without requiring a PLC integration.
How Availzyemachinistpro supports utilization tracking
Availzyemachinistpro is built around the data problems that make utilization calculations unreliable in the first place: missing timestamps, inconsistent downtime codes, and no single place to reconcile scheduled time against actual run time.
The platform's core features for utilization work include:
- Job Tracker: logs scheduled start/finish and actual runtime per work order, giving you the raw inputs for utilization without manual spreadsheet entry
- Maintenance Tracker: records planned and unplanned downtime with reason codes, so your Available Hours denominator is always accurate and auditable
- Tool Crib inventory management: tracks tool availability and low-stock alerts, reducing the "waiting for tooling" downtime category that quietly eats utilization
- Analytics dashboards: visualize utilization trends by machine, shift, or work center over time
- Shift notes and team collaboration: keep schedulers and operators aligned on planned stops so the denominator stays consistent
A shop moving from weekly manual Excel reports to Availzyemachinistpro's shift dashboards typically gains visibility into downtime reason codes they were previously lumping together as "idle." That granularity is what turns a utilization number into a corrective action.
Pro Tip: Use the Maintenance Tracker to log every planned PM window before the month starts. That pre-population of your Available Hours denominator means your utilization figures are calculation-ready on day one of the reporting period, not day five.
What is a good utilization rate?
The honest answer is: it depends on your shift model, product mix, and how you define Available hours. But there are defensible reference points.
Benchmark ranges
| Operation type | Target utilization range | Notes |
|---|---|---|
| Single-shift job shop | typically targets utilization in a range that leaves buffer for changeovers and variability | |
| Two-shift mixed production | typically targets utilization somewhat above single-shift levels due to tighter scheduling | |
| High-volume automated line | tends to target utilization higher than job shops due to lower variability | |
| 24/7 continuous process | targets utilization near maximum with planned maintenance as the main buffer |
Lean practitioners typically target 80–85% for single-shift operations. Pushing toward 95–100% removes the buffer needed for maintenance, changeovers, and schedule variability, and reliability suffers as a result.
The APQC benchmark for median OEE on critical production processes sits around 75%. Since OEE is always lower than utilization (it multiplies in performance and quality losses), a shop running 80% utilization with mediocre OEE is not actually in good shape.
Why chasing 100% backfires
High utilization can mask serious problems:
- A machine running at 95% utilization but producing 20% scrap looks great on a utilization report and terrible on a quality report
- No buffer means any unplanned breakdown immediately becomes a missed delivery
- Operators skip minor adjustments and inspections to keep runtime up, accelerating wear
Deliberately preserving a buffer portion of capacity improves resilience without meaningfully reducing throughput. The goal is consistent, sustainable utilization, not maximum utilization.
How to improve utilization without just running the machine more
Raising utilization is not about pressuring operators to start earlier. It is about removing the specific losses that are eating your available time. Here is a prioritized sequence.
- Implement preventive maintenance. Switching from reactive to preventive maintenance typically recovers 5–15% utilization by eliminating the long unplanned breakdowns that destroy shift efficiency. This is the highest-leverage starting point for most shops.
- Reduce changeover time. Changeover is often the single largest category of lost time in a job shop. Apply SMED (Single-Minute Exchange of Die) principles: separate internal setup (machine stopped) from external setup (done while machine runs), and standardize tooling offsets.
- Fix material and information flow. A machine waiting for raw stock or a missing program is a utilization loss that no amount of maintenance will fix. Map the material flow from receiving to machine and identify where jobs stall.
- Optimize the production schedule. Sequence jobs to minimize changeover time between similar setups. Batch similar materials and tooling families together. Even a rough scheduling improvement can recover several percentage points of utilization.
- Cross-train operators. A machine sitting idle because the only qualified operator is on break or absent is a staffing problem, not a machine problem. Cross-training two operators per machine eliminates this category of loss.
Quick wins in 30–90 days
- Standardize downtime reason codes so you can see exactly where time is going
- Pre-stage tooling and fixtures for the next job before the current one finishes
- Post utilization numbers on the shop floor daily so operators and supervisors see the same data
Pro Tip: Build a simple 2×2 matrix with "impact on utilization" on one axis and "effort to implement" on the other. Preventive maintenance and changeover reduction almost always land in the high-impact, medium-effort quadrant. Start there before touching scheduling software or capital equipment.
Common calculation mistakes that produce misleading numbers
Denominator errors
- Mixing calendar hours and scheduled hours in the same report. If one machine uses 8,760 hrs/year as its base and another uses 2,000 hrs/year, the comparison is meaningless. Pick one base and apply it everywhere.
- Forgetting to subtract planned stops. Including holidays and planned PM in Available hours inflates the denominator and makes utilization look worse than it is, which can trigger unnecessary capacity decisions.
- Changing the denominator mid-year without flagging it. A utilization trend line that looks like a drop in performance may just be a change in how Available hours were calculated.
Run-time counting errors
- Counting scrap production time as good run time. If a machine ran for two hours producing parts that all went to scrap, that time should not count as productive utilization without a separate quality adjustment.
- Double-counting support tasks. Operator time spent on inspection, deburring, or material handling at the machine is not machine run time. Keep the metric about the machine, not the operator.
- Including setup time inconsistently. Some shops count setup as run time; others do not. Neither is wrong, but switching between the two mid-report is.
Interpretation errors
- Using utilization alone to justify a capital purchase. A machine at 85% utilization might still have significant capacity if OEE is low. Before buying a second machine, check whether improving quality yield or cycle time on the existing one would close the gap.
- Treating utilization as a profitability proxy. High utilization on a low-margin job is not a win. Pair utilization data with your cost estimator to understand whether the hours being run are actually contributing to margin.
How to calculate machine utilization in Excel
Excel remains the most practical tracking tool for shops with fewer than 20 machines. Here is a plug-and-play setup.
Sheet structure
Set up two sheets: RawData (one row per shift or job) and Summary (calculated metrics by machine and period).
Core cell formulas
-
Available hours per row:
=C2-B2-(D2/60)where B2 = scheduled start, C2 = scheduled end, D2 = planned breaks in minutes -
Actual run hours per row:
=F2-E2where E2 = actual start, F2 = actual stop (formatted as time values) -
Utilization % per row:
=(G2/H2)*100where G2 = actual run hours, H2 = available hours -
Monthly utilization (Summary sheet):
=SUMIF(RawData!A:A,A2,RawData!G:G)/SUMIF(RawData!A:A,A2,RawData!H:H)*100where column A = Machine ID -
Lost hours:
=H2-G2 -
Unit-to-hours conversion:
=I2*J2where I2 = parts produced, J2 = standard cycle time in hours
Named ranges and charting tips
- Name the machine ID column
MachineIDand the utilization columnUtilPctfor cleaner SUMIF formulas. - Create a line chart on the Summary sheet plotting monthly utilization by machine. Add a horizontal reference line at your target (e.g., 80%) using a helper column filled with that constant.
- Apply conditional formatting to the utilization column: red below 70%, yellow 70–79%, green 80% and above. This turns the Summary sheet into a visual dashboard without any additional tools.
Template column layout (RawData sheet)
| Column | Field | Format |
|---|---|---|
| A | Machine ID | Text |
| B | Scheduled start | Date/Time |
| C | Scheduled end | Date/Time |
| D | Planned breaks (min) | Number |
| E | Actual start | Date/Time |
| F | Actual stop | Date/Time |
| G | Actual run hrs (formula) | Number |
| H | Available hrs (formula) | Number |
| I | Parts produced | Number |
| J | Standard cycle time (hrs) | Number |
| K | Utilization % (formula) | Number |
Key Takeaways
Machine utilization calculation requires a clearly defined Available Hours denominator; without it, the percentage is not comparable across machines, shifts, or reporting periods.
| Point | Details |
|---|---|
| Use the standard formula | Utilization (%) = (Actual production hours ÷ Available hours) × 100; define your denominator explicitly every time. |
| Pair utilization with OEE | High utilization can mask poor quality or slow cycles; APQC's median OEE benchmark of ~75% shows how much productive capacity is typically lost beyond runtime. |
| Target 80–85%, not 100% | Single-shift shops should preserve a 10–15% buffer; chasing maximum utilization removes the margin needed for maintenance and variability. |
| Prioritize PM and changeover reduction | Switching to preventive maintenance typically recovers 5–15% utilization; changeover reduction is the next highest-leverage action. |
| Availzye Machinist Pro automates the inputs | The Job Tracker and Maintenance Tracker capture scheduled vs. actual time and downtime codes, giving you calculation-ready data without manual spreadsheet entry. |
The number that actually tells you something
Most shops I have seen treat utilization as a report card, something you calculate at the end of the month and file. That is the wrong frame. The number is useful only when it is granular enough to point at a specific loss and recent enough to act on before the next shift.
The shops that get real mileage from utilization tracking share one habit: they break the lost-hours figure into categories every single week. Not "we were at 74%" but "we lost 18 hours to changeover, 9 hours to material wait, and 6 hours to a spindle bearing." That level of detail changes the conversation with maintenance and scheduling from vague frustration to a specific work order.
One practical rule worth keeping: if your utilization is below 75% and you are considering adding capacity, stop. Investigate the lost-hours breakdown first. In most cases, the capacity is already there. It is just buried in changeover time and unplanned breakdowns that a preventive maintenance schedule and a tighter setup process can recover. Add capacity only when utilization is consistently above 85% and OEE is also healthy.
*— Availzye
Availzyemachinistpro turns utilization data into daily decisions
Calculating utilization manually in Excel works, but it breaks down the moment you have more than a handful of machines or more than one person entering data. The real cost is not the spreadsheet time; it is the week-old numbers that arrive too late to change anything.

Availzyemachinistpro gives CNC shops a faster path from raw shift data to a utilization number you can act on. The Job Tracker logs scheduled and actual time per work order automatically, so your Available Hours denominator is built from real schedule data rather than a manual estimate. The Maintenance Tracker captures every planned and unplanned stop with reason codes, which means your downtime categories are already sorted before you open a report. The Tool Crib flags low-stock tooling before it becomes a mid-shift stoppage that never shows up in your downtime log but quietly kills utilization.
Analytics dashboards roll all of it into trend charts by machine, shift, or work center, updated in real time rather than at month-end. For a shop currently running weekly manual calculations, that shift alone tends to surface loss categories that were invisible in aggregated spreadsheet data.
Plans start at $9.99/month with a 7-day free trial. Start your free trial at Availzye Machinist Pro and connect your first machine's schedule to the Job Tracker today.
Useful sources and further reading
The sources below back the formulas, benchmarks, and guidance in this article and are worth bookmarking for ongoing reference.
- APQC OEE Benchmarking: APQC's open standards benchmarking data for OEE, including the median ~75% figure cited in the benchmarks section. Useful for comparing your shop's OEE against cross-industry peers.
- Overall Equipment Effectiveness (Wikipedia): A thorough reference for OEE, TEEP, and the Availability × Performance × Quality calculation framework. Good starting point for understanding how utilization fits into the broader OEE structure.
- Federal Reserve G.17 Industrial Production Release: The Federal Reserve's monthly capacity utilization data for U.S. manufacturing sectors. Useful context for understanding where your industry sits relative to national averages.
- Machine Utilization Rate Calculator (CalculatorLib): A quick online calculator for validating your utilization math, including the 18 ÷ 24 = 75% example used in the formulas section.
- TWC Industrial Utilization Calculator: Covers utilization and labor efficiency together, with guidance on the 80–85% single-shift target and the 5–15% recovery from preventive maintenance.
- Everhour Utilization Rate Guide: Practical explanation of denominator blindness and why labeling your base explicitly matters for consistent reporting.
- Availzye Machinist Pro: The platform's product overview, covering Job Tracker, Maintenance Tracker, analytics dashboards, and the full suite of CNC calculation tools referenced throughout this article.
| Source | What it provides |
|---|---|
| APQC OEE Benchmarking | Cross-industry OEE median (~75%) for benchmarking context |
| Federal Reserve G.17 | U.S. manufacturing capacity utilization by sector |
| CalculatorLib Calculator | Quick online validation of the standard utilization formula |
| TWC Industrial Calculator | Single-shift targets (80–85%) and PM recovery guidance |
| Everhour Guide | Denominator labeling best practices |
| Wikipedia OEE | Full OEE, TEEP, and Availability formula reference |
| Availzye Machinist Pro | Job Tracker, Maintenance Tracker, and dashboards for automated utilization tracking |