
The reorder point formula for most CNC shop items is ROP = (Average Daily Demand × Lead Time) + Safety Stock, where demand is in units/day and lead time is in days. For critical tooling or anything with unpredictable consumption, use the statistical variant: ROP = (D × LT) + (Z × σd × √LT). Quick recommendation: steady high-volume fasteners and consumables belong on the basic formula; variable-demand end mills, inserts, and bespoke fixtures need the statistical version.
A note on scale: research confirms that lead-time demand — the units consumed while you wait for a replenishment — is the core of every ROP calculation. Safety stock sits on top as a buffer, not a substitute for accurate demand measurement.
Table of Contents
- What does each variable in the reorder point formula actually mean?
- Which safety stock method fits your shop inventory?
- Two shop-ready worked examples
- Basic ROP vs. statistical ROP: how to choose
- How to measure demand, standard deviation, and lead time accurately
- How lowering lead time shrinks your reorder point
- How to configure ROP in Availzyemachinistpro Tool Crib
- How often should you recalculate reorder points?
- Common ROP mistakes and how to fix them
- Key Takeaways
- The part most shops get wrong about reorder points
- Availzyemachinistpro puts your reorder triggers on autopilot
- Useful sources
What does each variable in the reorder point formula actually mean?
Getting the units right matters more than most shops realize. A mismatch between daily demand expressed in pieces and lead time expressed in weeks produces a reorder trigger that is off by a factor of seven.
Core variables and their units:
- D (Average Daily Demand): Units consumed per day. Count actual usage from transaction logs, not planned quantities. If your shop uses 15 carbide inserts on a typical production day, D = 15 units/day.
- LT (Lead Time): Calendar days from purchase order placement to the item being verified and available at the tool crib. Always convert weeks to days before entering the formula. A two-week supplier lead time is LT = 14 days.
- SS (Safety Stock): The buffer inventory held above expected lead-time demand. Calculated separately using either the max-min method or the statistical method described below.
- σd (Standard Deviation of Daily Demand): How much daily consumption varies around the average. Compute this from your usage log. High σd means unpredictable demand.
- Z (Service-Level Factor): A multiplier drawn from the standard normal distribution. Common values:
| Target Service Level | Z Value |
|---|---|
| 90% | 1.65 |
| 95% | 1.65 |
| 99% | 2.33 |
Most CNC shops run critical tooling at 95% (Z = 1.65), accepting a roughly 1-in-20 chance of a stockout per replenishment cycle. Non-critical consumables often sit at 90%.
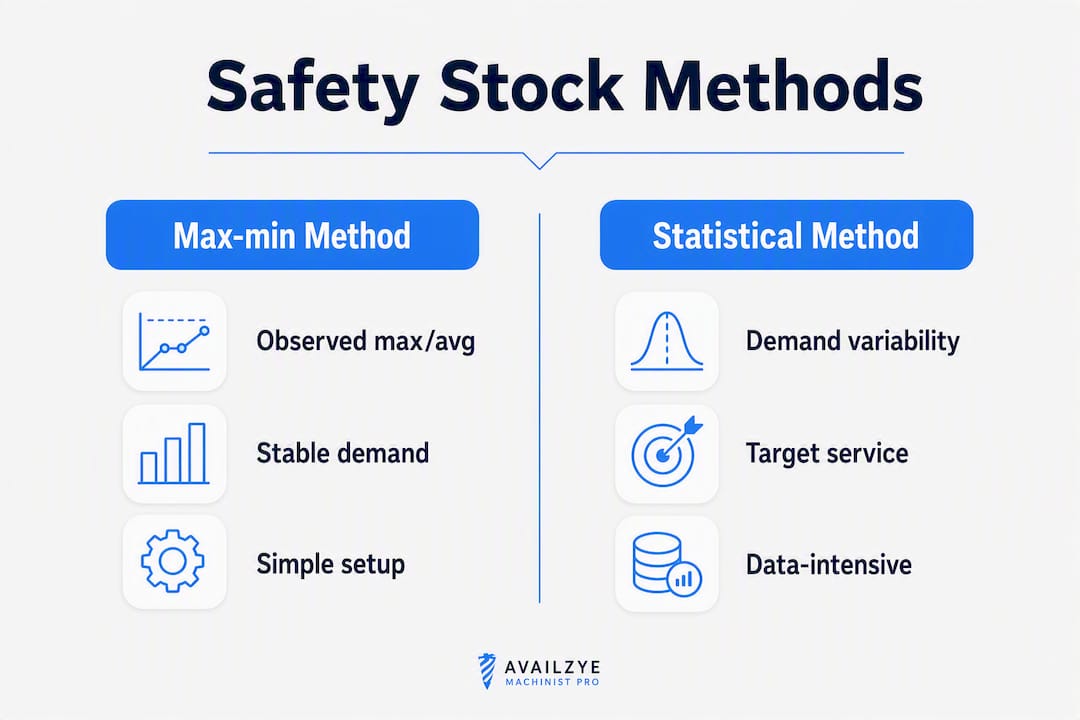
Which safety stock method fits your shop inventory?
Two methods dominate shop practice. The right one depends on how predictable your demand is.
Max-min method (practical)
Formula: SS = (Max daily usage × Max lead time) − (Avg daily usage × Avg lead time)

This is the standard practical calculation used when you have a feel for worst-case scenarios but lack detailed usage logs. It sizes safety stock to cover the gap between your worst observed week and your typical week.
Best for: fasteners, standard drill blanks, cutting fluid, and other high-volume items with relatively stable demand. Quick to compute, easy to explain to purchasing.
Weakness: it relies on observed maximums, which may understate true variability for newer SKUs or items with seasonal spikes.
Statistical method
Formula: SS = Z × σd × √LT
This ties directly to a target service level and uses actual demand variability. It is the right tool for variable-demand environments where stockouts carry real production cost.
Best for: critical end mills, custom inserts, and bespoke fixtures where a stockout stops a job.
Weakness: requires a clean usage history of at least 20–30 data points to produce a meaningful σd.
| Method | Data needed | Best item type | Stockout protection |
|---|---|---|---|
| Max-min | Observed max/avg | Stable consumables | Moderate |
| Statistical (Z × σd × √LT) | Usage log + service level | Critical/variable tooling | Targeted (by Z) |
Pro Tip: If you have fewer than three weeks of usage data for a new SKU, use the max-min method with a conservative max estimate until you accumulate enough history for a statistical calculation.
Two shop-ready worked examples
Example A: steady fastener (basic ROP)
A shop uses M6 socket head cap screws at a consistent rate.
- Average daily demand (D): 40 screws/day
- Supplier lead time: 7 days (confirmed delivery, no receiving delay)
- Receiving/inspection buffer: 1 day → LT = 8 days
- Safety stock (max-min): (50 screws/day × 10 days) − (40 × 8) = 500 − 320 = 180 screws
- ROP = (40 × 8) + 180 = 320 + 180 = 500 screws
When the bin count hits 500, place the order. At the current burn rate, those 500 screws last exactly 12.5 days, covering the 8-day replenishment window with 4.5 days of buffer.
Example B: critical tooling with variable demand (statistical ROP)
A shop runs a mix of aluminum and steel jobs, so 10 mm carbide end mill consumption swings week to week.
- Average daily demand (D): 3 end mills/day
- Standard deviation of daily demand (σd): 1.2 end mills/day (computed from 30 days of usage logs)
- Lead time: 5 days (supplier) + 1 day (receiving) = LT = 6 days
- Target service level: 95% → Z = 1.65
- Statistical safety stock: SS = 1.65 × 1.2 × √6 = 1.65 × 1.2 × 2.449 = 4.85 → round up to 5 end mills
- ROP = (3 × 6) + 5 = 18 + 5 = 23 end mills
When the tool crib count drops to 23, trigger the reorder. The 5-unit safety stock absorbs demand spikes without leaving you scrambling for a same-day supplier call.
Key figure: The service-level factor Z = 1.65 corresponds to a high service level commonly used to balance stockout risk and inventory cost. Raising to Z = 2.33 (99%) nearly doubles safety stock for the same item — a real carrying-cost trade-off worth calculating explicitly.
Basic ROP vs. statistical ROP: how to choose
Use this checklist before picking a formula.
Use the basic ROP when:
- Demand varies less than ±20% week to week
- Lead time is consistent (same supplier, same shipping lane)
- The item is a commodity with low stockout cost
- You lack sufficient usage history for a reliable σd
Use the statistical ROP when:
- Daily demand swings significantly (job-mix changes, seasonal contracts)
- A stockout stops production or triggers an emergency buy
- Lead time itself varies (multiple suppliers, spot buys)
- You have at least 20–30 days of clean usage data
Picking the wrong method has a real cost in both directions. The modified reorder level formula — using maximum daily usage instead of average — is a useful middle ground when demand occasionally spikes but full statistical modeling is impractical.
Pro Tip: Sanity-check any ROP by dividing it by your average daily demand. The result should equal your lead time in days plus your safety stock in days. If it does not, you have a unit mismatch somewhere.
How to measure demand, standard deviation, and lead time accurately
Garbage in, garbage out. These steps produce defensible inputs.
- Pull transaction history from your tool crib or ERP for the past 30–60 days. Use actual withdrawals, not planned quantities.
- Choose your measurement window. A recent full month usually reflects current run rates better than a six-month average, especially after a job-mix change. Weight recent weeks more heavily when demand is trending.
- Compute average daily demand (D): total units consumed ÷ number of working days in the window.
- Compute σd: calculate the standard deviation of daily usage across each day in the window. Use the sample formula (divide by n−1) when you have fewer than 30 data points.
- Measure lead time end-to-end: log the date of PO placement, the delivery date, and the date the item clears receiving inspection and hits the shelf. The last date is what matters for ROP.
| Lead-time component | Typical range | Notes |
|---|---|---|
| Supplier processing | 1–3 days | Confirm with supplier SLA |
| Transit | 2–7 days | Varies by carrier and distance |
| Receiving/inspection | 1–2 days | Often omitted — include it |
| Put-away | — | Relevant for high-security tool cribs |
Data quality checks: remove outlier days caused by shutdowns or one-off large orders before computing averages. Flag any SKU where the last 30 days look materially different from the prior 30 — that is a signal to use the recent window only, not a blended average.
How lowering lead time shrinks your reorder point
The math is direct. In Example B above, if the supplier cuts processing from 5 days to 3 days (LT drops from 6 to 4 days):
- Lead-time demand: 3 × 4 = 12 (was 18)
- New SS: 1.65 × 1.2 × √4 = 1.65 × 1.2 × 2 = 3.96 → 4 end mills (was 5)
- New ROP = 12 + 4 = 16 (was 23)
That 7-unit reduction in ROP means 7 fewer end mills sitting idle in the crib at any given time. For a $45 end mill, that is $315 in freed working capital on a single SKU. Multiply across 50 critical SKUs and the number gets interesting fast.
Practical supplier tactics:
- Negotiate lead-time SLAs with your top three suppliers and track actual vs. promised delivery in your vendor contact records.
- Consolidate shipments from a single distributor to qualify for priority processing.
- Explore vendor-managed stock or consignment for your highest-velocity items.
- Identify local distributors for critical tooling so emergency replenishment is a same-day option, not a two-day freight decision.
Pro Tip: Before negotiating a lead-time SLA, calculate the ROP reduction and the inventory dollar savings it produces. A supplier who sees a concrete number — "cutting your lead time by two days saves us $8,000 in tied-up stock annually" — has a clearer reason to prioritize your account.
How to configure ROP in Availzyemachinistpro Tool Crib
Availzyemachinistpro's Tool Crib maps directly to the formula variables. Here is how to set it up cleanly.
Field mapping:
- Set the reorder threshold field to your calculated ROP value (the number from your formula).
- Record average daily demand and lead time in the item notes or a custom field so the next person recalculating knows the inputs.
- Log σd and Z for statistical items so the safety stock figure is auditable.
Import and automation:
- Use CSV import to load ROP values for multiple SKUs at once. Column headers should match the Tool Crib field names exactly; a mismatch silently skips rows.
- Enable low-stock alerts so the system notifies the purchasing contact the moment on-hand quantity crosses the ROP threshold.
- Schedule a monthly recalculation reminder in the Maintenance Tracker or shift notes to prompt a review of D and LT inputs.
Pilot plan:
- Select 10 SKUs: your five highest-velocity consumables and your five most stockout-prone critical tools.
- Calculate ROP for each using the appropriate method.
- Import into Tool Crib and activate alerts.
- Run parallel monitoring for 4–6 weeks: compare alert triggers against actual order dates and adjust thresholds where alerts fire too early or too late.
- Roll out to remaining SKUs once thresholds feel calibrated.
The audit log in Tool Crib records every threshold change with a timestamp and user, which matters when a purchasing manager asks why an order went out early.
Pro Tip: Use the Job Tracker to cross-reference active work orders against tool crib levels. A large job about to start is a demand spike you can see coming — adjust ROP inputs before the job kicks off, not after the first stockout.
How often should you recalculate reorder points?
A monthly review is the right default for most shops. Pull the last 30 days of usage data, recompute D and σd, check whether lead times have drifted, and update Tool Crib thresholds accordingly. The whole process for a 50-SKU shop takes under two hours once the data pipeline is clean.
Recalculate immediately when any of these occur:
- A new long-term contract changes your production mix
- A supplier disruption extends lead time by more than two days
- A machine goes down for extended maintenance, shifting tool consumption patterns
- A seasonal contract begins or ends
Role assignments matter. Designate one person as the ROP owner for each item category. That person approves threshold changes and records the reason in the audit log. Without ownership, thresholds drift because everyone assumes someone else is watching.
Pro Tip: Set a calendar reminder tied to your quarterly supplier review. Supplier lead times often change at contract renewal — catching a two-day extension before it causes a stockout is worth the 15 minutes it takes to recalculate.
Common ROP mistakes and how to fix them
Omitting receiving time. The most frequent error. If your supplier delivers in five days but inspection and put-away take another day and a half, your effective LT is 6.5 days, not 5. Every ROP built on the shorter number is systematically too low.
Using a long-term average during demand shifts. A 12-month average smooths out a job-mix change that happened two months ago. Use a recent-month snapshot when the shop's work has changed materially.
Double-counting buffers. Some shops add safety stock in the formula AND set the reorder threshold higher "just in case." The result is excess inventory that ties up cash and obscures real consumption signals.
Mismatched units. Lead time in weeks, demand in units/day — a classic mismatch. Always confirm units are consistent before running the calculation.
Red flags that signal a serious problem:
- Frequent emergency buys from spot suppliers at premium prices
- High write-off rates on expired or obsolete stock (over-ordering)
- The same SKU triggers a stockout more than twice in a quarter
Pro Tip: If emergency buys are a recurring pattern for the same SKU, check whether the ROP is set correctly AND whether the purchasing team is actually acting on alerts. A correct threshold that nobody responds to is the same as no threshold at all.
Stat check: AccountingTools notes that using maximum daily usage instead of average in the reorder level formula is a deliberate conservative adjustment — not an error — when demand spikes are common. Know which version you are using and document it.
Key Takeaways
The reorder point formula only works when its inputs — demand, lead time, and safety stock — are measured accurately and reviewed on a consistent cadence.
| Point | Details |
|---|---|
| Use the right formula | Steady consumables use basic ROP; critical or variable-demand tooling needs the statistical variant with Z and σd. |
| Include receiving time | Lead time ends when the item is on the shelf, not when the truck arrives — omitting this step systematically undersets every ROP. |
| Review monthly | Recalculate D and LT every 30 days, and immediately after any job-mix change or supplier disruption. |
| Lower lead time to free capital | Reducing supplier lead time decreases reorder points and the capital tied up in inventory safety stock. |
| Availzyemachinistpro Tool Crib | Use Tool Crib's CSV import, low-stock alerts, and audit logs to automate ROP triggers and maintain a defensible change history. |
The part most shops get wrong about reorder points
The formula itself is not the hard part. Any machinist can multiply daily demand by lead time and add a buffer. What actually breaks down in practice is the discipline around inputs and ownership.
Shops that struggle with stockouts almost always have one of two problems: they set ROPs once and never touch them again, or they have no clear owner for the numbers. ROP is not a static number. A shop running aerospace contracts in Q1 and automotive in Q3 has different demand profiles in each period. A supplier that adds two days to their lead time in the summer changes every ROP that depends on them. Treating these as set-and-forget parameters is what turns a well-designed inventory policy into a source of emergency buys and production delays.
The statistical formula with Z-scores gets a lot of attention, and it deserves it for critical tooling. But the bigger win for most shops is simply measuring lead time correctly (including receiving time), using a recent demand window instead of a 12-month average, and assigning someone to review the numbers monthly. Those three habits outperform a sophisticated formula built on stale data.
Software helps, but only if the governance is there. An alert that fires at the wrong threshold, or one that the purchasing team ignores, is worse than no alert — it creates false confidence. The audit log matters precisely because it forces accountability: when a threshold changes, someone's name is on it.
Availzyemachinistpro puts your reorder triggers on autopilot
Calculating ROP by hand works for five SKUs. At fifty, it becomes a spreadsheet maintenance job that nobody owns. Availzyemachinistpro's Tool Crib is built for exactly this: load your calculated ROP thresholds via CSV, activate low-stock alerts, and let the system flag reorder events the moment on-hand quantity crosses the line. The check-in/check-out workflow keeps consumption data current, so your next recalculation starts from real numbers, not guesses.

The audit log records every threshold change with a timestamp and user, giving purchasing and shop management a clear paper trail. Pair Tool Crib with the Job Tracker to spot demand spikes before they hit the crib, and use the cost estimator to quantify the carrying-cost trade-off when you are deciding between a tighter or looser safety stock. Plans start at $9.99/month. Try it free for 7 days at availzye-machinist-pro.com.
Useful sources
The formulas and guidance in this article draw from the following authoritative references:
- Reorder point (Wikipedia) — encyclopedic overview of ROP variants and the EOQ model context
- Reorder Point Formula + Free Calculator (InventoryQuick) — canonical formula definition and unit guidance
- Reorder Point Formula: Safety Stock (inFlow Inventory) — practical max-min safety stock method with examples
- Reorder Point Formula: Guide with Worked Examples (SupplyChainMath) — statistical ROP formula, Z-score table, and variable-demand worked examples
- Reorder level formula (AccountingTools) — modified reorder level using maximum daily usage and common misconceptions
- Reorder Point Defined: Formula & How to Use (NetSuite) — unit consistency guidance and practical numerical examples
For deeper statistical derivations and service-level tables, SupplyChainMath is the most technically detailed free resource. For a quick calculator to validate your numbers, InventoryQuick's tool is worth bookmarking. For inventory replenishment workflows that connect ROP triggers to automated purchasing, MDMS offers a practical reference on how replenishment automation works in shop-floor systems.