
Calculate OEE for a machine as Availability × Performance × Quality. Before you touch the formula, collect five numbers from the shift you want to score: planned production time, run time (or its inverse, stop time), ideal cycle time, total part count, and good part count.
- Planned production time (the minutes the machine was scheduled to run)
- Run time or stop time (actual production minutes, or downtime minutes)
- Ideal cycle time (the fastest validated time to make one part)
- Total count (every part the machine produced)
- Good count (parts that pass on the first pass, no rework)
Benchmark check: 85% OEE is world-class, 60% is typical for a shop with room to improve, and 40% is common for a shop just starting to track the number.
Key Takeaways
Calculating OEE for a machine shop works only when Availability, Performance, and Quality are measured with the same frozen definitions across every shift.
| Point | Details |
|---|---|
| Use the multiplicative formula | OEE = Availability × Performance × Quality, not a single shortcut fraction. |
| Collect five inputs first | Planned production time, run time, ideal cycle time, total count, and good count. |
| Benchmark against 85/60/40 | 85% is world-class, 60% is typical, 40% is a common starting baseline. |
| Freeze your definitions | Lock changeover, micro-stop, and rework rules for several weeks before comparing shifts. |
| Automate once it scales | Availzyemachinistpro's Job Tracker and Maintenance Tracker capture Availability and downtime data automatically as you grow past manual logging. |
Table of Contents
- How to Calculate OEE for a Machine Shop, Step by Step
- Simple OEE Formula vs. the Preferred Formula
- Calculating Availability on the Shop Floor
- Calculating Performance for High-Mix CNC Work
- Calculating Quality Without Fooling Yourself
- A Worked OEE Calculation for One CNC Shift
- The Six Big Losses and Where They Hit Your Score
- What Your OEE Score Actually Means
- Setting Up Reliable OEE Data Collection
- Common OEE Calculation Mistakes and How to Fix Them
- Turning OEE Numbers Into a Repeatable Shop Workflow
- Start With One Machine, Not the Whole Shop
- Get Your OEE Numbers Without the Spreadsheet Fight
- Sources
How to Calculate OEE for a Machine Shop, Step by Step
Pick a shift or a fixed block of time, like an 8 hour run on one CNC mill. That's your window. Everything else gets measured against it.
- Define the time window (one shift, one job, or one day).
- Calculate planned production time: total shift minutes minus scheduled breaks and planned maintenance.
- Log every unplanned stop with a timestamp and reason code.
- Compute run time: planned time minus total unplanned downtime.
- Pull ideal cycle time from the part program or a validated time study.
- Record total parts made and good parts (first-pass, no rework).
- Calculate A, P, and Q, then multiply them for OEE.
Shop-floor checklist: operator logs stops in real time; supervisor confirms reason codes at shift end; quality logs good/scrap counts at the same cadence.
Pro Tip: Log every stop over one minute, even the ones that feel too small to matter. A worked OEE example built on five clean inputs shows that a dozen two-minute waits for a fixture check can quietly erase an entire shift's worth of Availability, and most shops never write those down.
Simple OEE Formula vs. the Preferred Formula
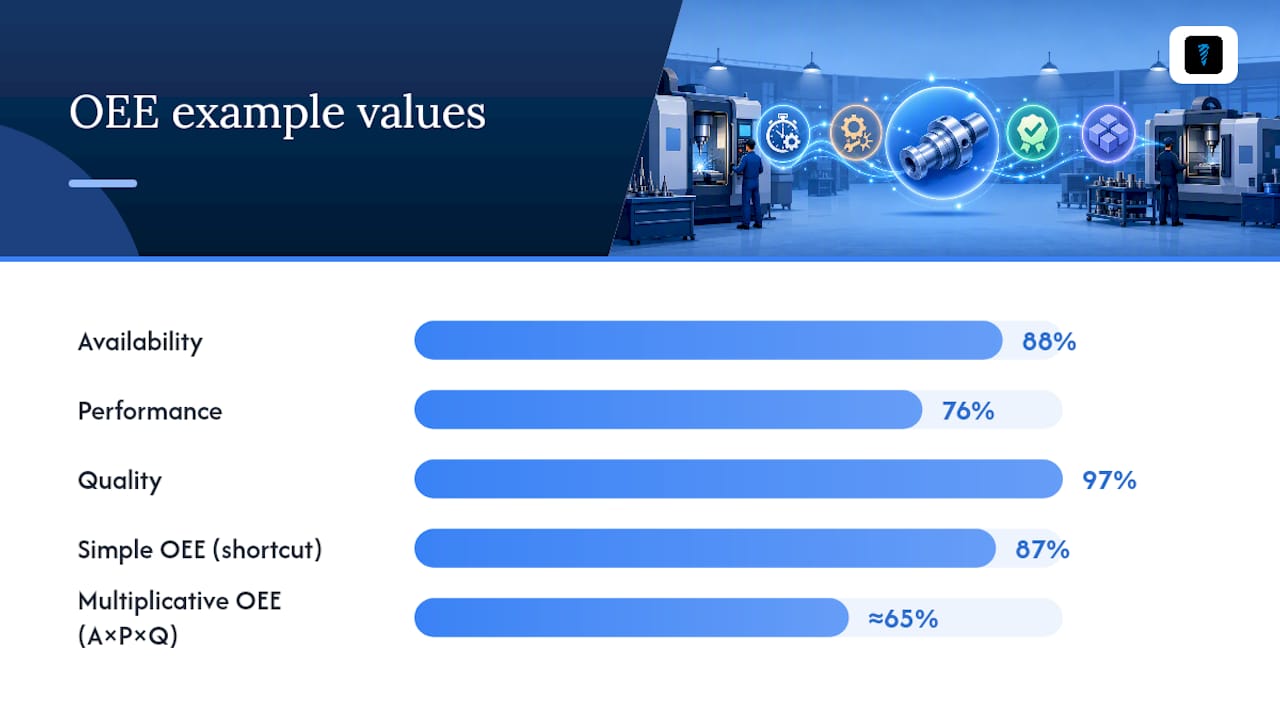
The quick version some shops use is a single-fraction shortcut: good parts made divided by parts that theoretically could have been made in the planned time. It's fast, but it hides which factor is actually broken.
The preferred, industry-standard version breaks that same result into three separate percentages and multiplies them:
- OEE = Availability × Performance × Quality
Each factor is its own diagnostic. A canonical OEE calculation treats A, P, and Q as independent scores that compound rather than average, which is exactly why the multiplicative version wins in practice. Run the math: 88% Availability times 76% Performance times 97% Quality doesn't land near 87%. It comes out to roughly 65%. Losses stack multiplicatively, not additively, and that gap is the whole reason the simple formula misleads people who only look at the total.
Calculating Availability on the Shop Floor
Availability = Run Time ÷ Planned Production Time.
Run time is minutes the machine actually cut chips. Planned production time is the shift length minus scheduled breaks, minus planned maintenance, minus anything the shop deliberately excludes from the schedule.
Log every stop cause separately:
- Unplanned breakdowns
- Changeovers and setups
- Inspection or first-piece holds
- Operator waits (material, fixture, tooling)
The Availability boundary that trips up most shops is changeover. Decide once whether setup time counts as planned or unplanned, and never let that rule shift between shifts.
Pro Tip: Set a firm cutoff, like sixty seconds, for what counts as a loggable micro-stop. Below that, it's noise; above it, it's data.
Calculating Performance for High-Mix CNC Work
Performance = (Ideal Cycle Time × Total Count) ÷ Run Time.
Think of it as actual throughput divided by theoretical throughput at full speed.
Ideal cycle time should come from the machine's rated feed rate or a validated time study, never from an average of "how long it usually takes." Averages already contain the losses you're trying to measure, which quietly inflates your Performance score.
Speed loss shows up as reduced feed rates, minor stops that don't get logged, and cycle time creep as tools wear. In a job shop running five different parts on one mill in a shift, calculate a weighted ideal time: multiply each part's own ideal cycle time by its count, then sum those before dividing into run time. A shop-floor step-by-step approach to high-mix Performance backs this weighting method specifically for job shops.
Calculating Quality Without Fooling Yourself
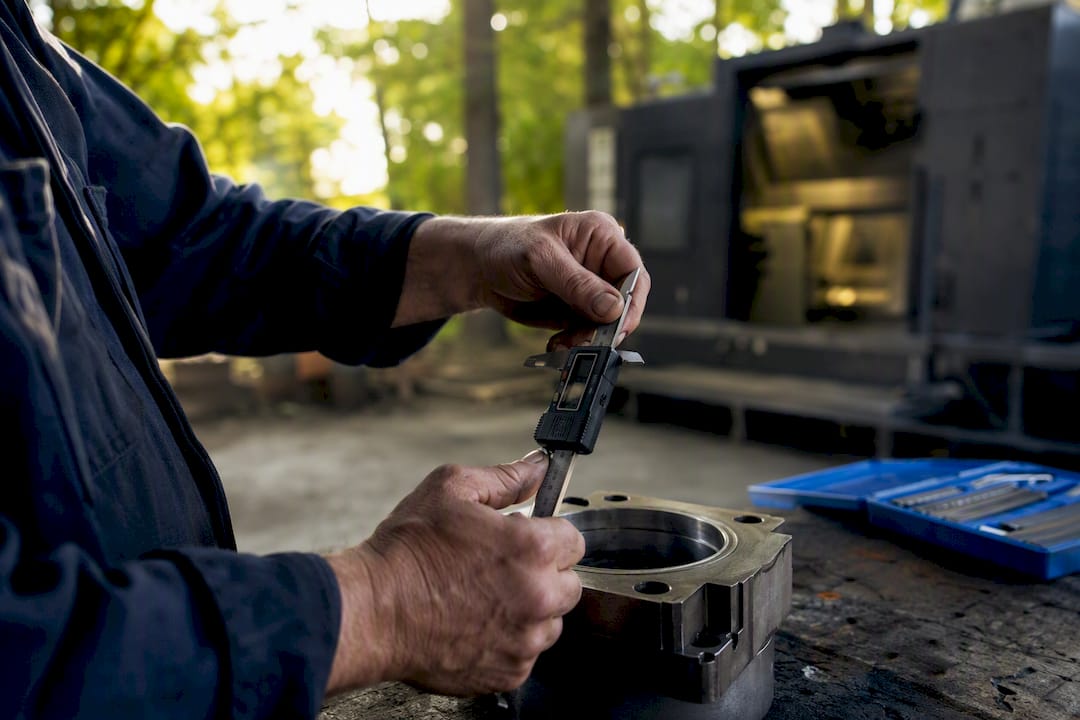
Quality = Good Count ÷ Total Count.
Good means first-time-right: a part that passed inspection without any rework, touch-up, or reprocessing. Standard practice treats reworked parts as a quality loss, not a save, even if the part eventually shipped.
Two edge cases trip up most shops:
- Startup rejects after a tool change or warm-up count as scrap, not exceptions.
- Count quality at the machine operation's output, not at final shipment, so multi-op routing doesn't hide which station caused the defect.
A Worked OEE Calculation for One CNC Shift
Here's a real shift on a single vertical mill, the kind of numbers you'd pull straight from a shift log.
| Input | Value |
|---|---|
| Planned production time | 480 minutes |
| Unplanned downtime | 58 minutes |
| Ideal cycle time | 2.0 minutes/part |
| Total count | 175 parts |
| Good count | 162 parts |
- Run time = 480 − 58 = 422 minutes
- Availability = 422 ÷ 480 = 87.9%
- Performance = (2.0 × 175) ÷ 422 = 350 ÷ 422 = 82.9%
- Quality = 162 ÷ 175 = 92.6%
- OEE = 0.879 × 0.829 × 0.926 = 67.5%
That 67.5% sits above the 60% typical band but well short of world-class. The dominant loss here is Performance, not downtime. Availability actually looks decent at 88%. The next question to ask on the floor isn't "why did the machine stop," it's "why did it run slower than programmed for over an hour's worth of cycles." Check feed override settings, tool wear schedules, and whether the operator was hand-adjusting speeds mid-run.
The Six Big Losses and Where They Hit Your Score
- Equipment failures — unplanned breakdowns, hits Availability
- Setup and adjustments — changeovers and tooling swaps, hits Availability
- Idling and minor stops — micro-stops under a few minutes, hits Availability
- Reduced speed — running slower than ideal cycle time, hits Performance
- Startup rejects — scrap during warm-up or first pieces, hits Quality
- Production rejects — scrap during steady-state running, hits Quality
In most job shops, setup and adjustment losses are the fastest to shrink, since a standardized changeover checklist or quick-swap tooling attacks a cause you control directly, unlike a surprise spindle failure.
What Your OEE Score Actually Means
The 85/60/40 benchmark set isn't arbitrary. Each band describes a different mix of remaining losses.
- 85% or above: only small, well-controlled losses remain across all three factors
- 60%: typical for shops actively managing production but still carrying real changeover, speed, or scrap losses
- 40%: common for shops in their first months of tracking, usually dominated by one glaring loss once you decompose it
Because the three factors multiply rather than add, a five-point loss in Availability costs you the same absolute OEE points as a five-point loss in Quality. That's why OEE works well as a prioritization tool: find whichever factor is furthest from its own realistic ceiling and fix that one first. Set short-term targets as 5 to 10 point lifts per quarter rather than jumping straight for 85%.
Setting Up Reliable OEE Data Collection
- Shift log (paper or digital): cheapest to start, but relies entirely on operator discipline.
- Operator entries via tablet or terminal: faster and timestamped, still needs a clear reason-code list.
- PLC or SCADA integration: captures stops automatically, best for machines already networked.
- Part counters and external sensors: remove counting errors entirely from Quality and Performance math.
A usable tracking sheet needs four fields on every logged event: timestamp, duration, reason code, and the operator or system that logged it. Skip any of those four and you can't audit the data later.
Automating capture makes sense once you're tracking three or more machines, or once manual logging eats more than two hours a week of a supervisor's time. Below that threshold, a disciplined paper or spreadsheet process works fine, provided everyone follows the same rules.
Pro Tip: Tools like a machine utilization tracker can cross-check manual logs against actual spindle-on time, which is the fastest way to catch an operator who's rounding downtime in their head instead of writing it down.
Common OEE Calculation Mistakes and How to Fix Them
- Excluding changeover from downtime inflates Availability. Fix: decide once whether setup is planned or unplanned, and apply that rule to every shift.
- Using average cycle time as "ideal" inflates Performance. Fix: pull ideal cycle time from the program or a real time study, not historical averages.
- Ignoring stops under a minute hides real Availability loss. Fix: set and enforce a logging cutoff (see the cutoff rule above).
- Counting reworked parts as good inflates Quality. Fix: only first-pass parts count; rework is a loss, always.
- Inconsistent planned-stop rules between shifts makes shift-to-shift comparisons meaningless. Fix: write the rules down once and audit against them monthly.
Pro Tip: Once a quarter, pull the same raw stop-log data and have two different people calculate OEE from it independently. If their numbers don't match, you've found where your definitions are drifting.
Turning OEE Numbers Into a Repeatable Shop Workflow
Calculating OEE by hand once is useful. Calculating it the same way, every shift, without a spreadsheet fight, is what actually changes a shop's performance. That's the gap Availzyemachinistpro is built to close.
- Job Tracker captures planned production time per work order automatically, so you're not reconstructing shift schedules from memory.
- Maintenance Tracker logs downtime causes tied to specific machines, giving Availability real reason codes rather than guesswork.
- Tool Crib ties tool changes and tool life data back to setup and changeover losses.
- Analytics dashboards decompose the final OEE number back into Availability, Performance, and Quality automatically.
The workflow runs simple: an operator logs a stop, the system tags the reason, and the dashboard shows exactly which factor dropped and by how much, the same shift it happened.
Most shops don't lack the will to track OEE. They lack a place to put the data that doesn't die in a spreadsheet nobody opens after week two. Structured capture beats a perfect formula applied inconsistently.
Start With One Machine, Not the Whole Shop
Pick one machine or one shift and calculate OEE the same way, using the same definitions, for twelve straight weeks before rolling it out further. Consistency in how you count stops and cycle times matters more than getting a perfect number on day one. Once the workload justifies it, automate capture rather than fighting a spreadsheet every week.
Get Your OEE Numbers Without the Spreadsheet Fight
You've seen the manual math. Now imagine the same Availability, Performance, and Quality breakdown building itself every shift, without someone reconstructing stop logs from memory at 5 p.m.

Availzyemachinistpro's G-code generator cuts setup and programming time before the spindle even starts, which shrinks one of the Six Big Losses before you've logged a single stop. Pair that with the platform's Job Tracker and Maintenance Tracker, and your Availability and Quality inputs start capturing themselves instead of living in a supervisor's notebook. Start with one machine on the 7 day free trial, connect your first job, and watch your first real A/P/Q dashboard populate before the shift ends.