Measure your cycle time accurately, then control work-in-process and attack the true bottleneck. That single sequence drives more improvement than any other move a shop can make, and it costs nothing but discipline.
Teams that combine WIP control with SMED-style changeover work typically report 20 to 50 percent cycle-time reductions on scoped jobs, without new equipment. That range depends heavily on how bad your queue time is today, but it's realistic for most job shops carrying more work-in-process than their bottleneck can absorb.
Here's your first move, and you can start it this week:
- Pick the machine or cell you already suspect is your bottleneck.
- Write a one-sentence definition of where its cycle starts and stops (first touch to unload, for example).
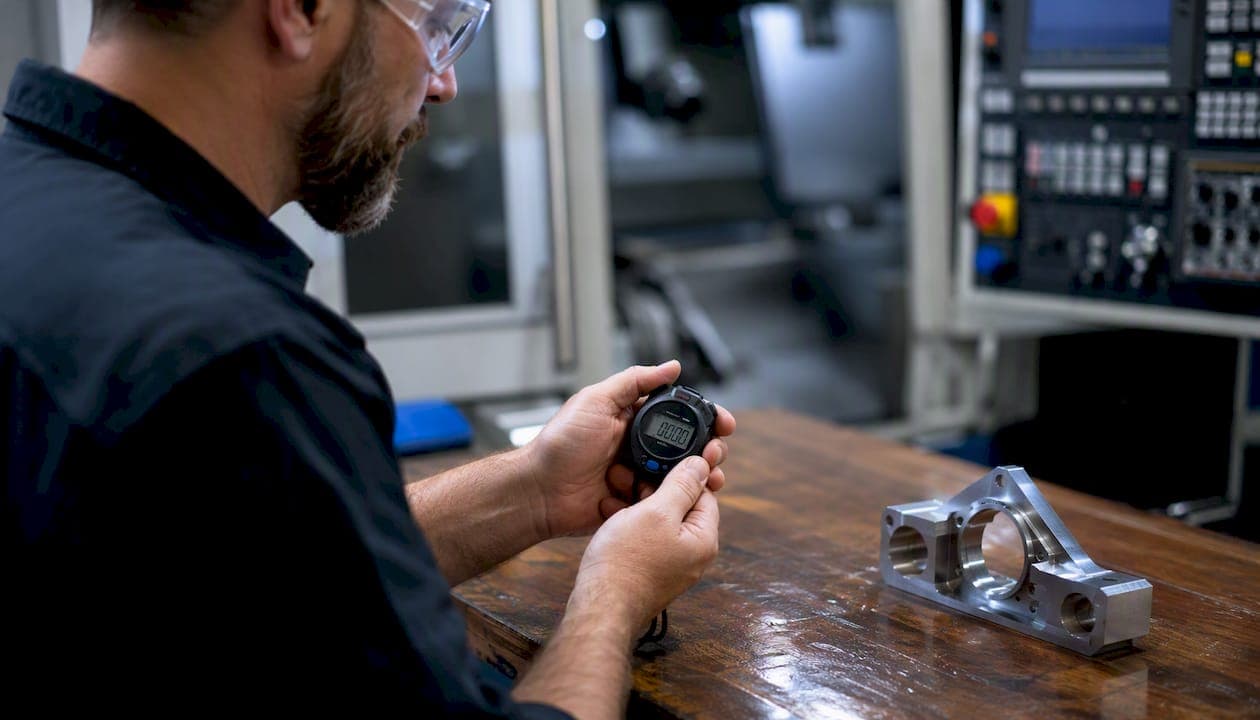
- Time 50 to 100 cycles under normal conditions, not a cherry-picked clean run.
- Calculate the average, the median, and the 85th percentile before you change anything.
Everything else in this guide builds on that baseline. Skip it, and you're guessing.
Key Takeaways
Cycle time reduction succeeds when teams measure consistently, control WIP, and target the true bottleneck before investing in new equipment or automation.
| Point | Details |
|---|---|
| Measure before you change anything | Time 50 to 100 cycles under normal conditions and calculate average, median, and 85th percentile. |
| Queue time usually dominates | Processing time is often just 10 to 20% of total cycle time; the rest is waiting and queue. |
| WIP control is the highest-leverage first move | Capping work-in-process reduces queue time within two to four weeks at no equipment cost. |
| Pilot one cell for 8 to 12 weeks | A scoped pilot with weekly review commonly produces 20 to 50% cycle-time gains. |
| Availzye Machinist Pro backs the pilot | Feeds and speeds, deflection, Tool Crib, and Maintenance Tracker features support diagnosis and verification. |
Table of Contents
- What Is Cycle Time Reduction and How Do You Measure It?
- How Do You Break Cycle Time Down to Find the Real Losses?
- What Are the Most Effective Ways to Reduce Cycle Time?
- How Do You Run a 12-Week Cycle Time Reduction Pilot?
- Which KPIs Keep Cycle Time Gains From Sliding Back?
- Where Do Calculators and Trackers Fit Into a Cycle Time Pilot?
- Why Does Workforce Training Change Cycle Time Outcomes?
- How Does Shop Floor Layout Affect Cycle Time?
- Can Simulation and Analytics Tools Improve Cycle Time Optimization?
- What I've Learned Running Cycle Time Pilots
- How Availzye Machinist Pro Supports Your Cycle Time Pilot
- Sources
What Is Cycle Time Reduction and How Do You Measure It?
Cycle time is the elapsed time from the start of one unit of work to the start of the next, measured at a single station or process step. It's easy to confuse with two related terms, and mixing them up leads to bad decisions. Lead time is the total time from order placement to shipment, including queue time before the process even begins. Takt time is the pace demand requires, calculated as available production time divided by customer demand. You can have a perfectly stable cycle time and still miss takt if demand outpaces your capacity, or hit takt with a wildly inconsistent cycle time that just happens to average out.
Getting cycle time reduction right starts with agreeing on boundaries. Three common start/stop conventions cause most of the confusion on a shop floor:
- First touch to first touch. The clock starts when the operator picks up the raw part and starts again when they pick up the next one. This captures load and unload time along with machining.
- Machine start to machine start. The clock starts at cycle initiation on the control and resets at the next cycle initiation. This isolates spindle-on time but hides manual handling.
- Unload-and-inspect to unload-and-inspect. The clock includes the inspection step, which matters if quality checks are a real source of delay, not just paperwork.
None of these is universally "correct." Pick one, document it on the shop-floor board, and never let two departments use different definitions for the same part number. That single fix prevents more arguments than any software purchase.
Data collection options range from a clipboard and stopwatch to a full SCADA system pulling cycle data automatically off the machine control. Manual timestamps work fine for a pilot on one or two machines. Shop-floor tablets logged against a job number scale better across a cell. PLC or SCADA integration and OEE systems give you the cleanest data at volume, but they take longer to set up and aren't worth the investment until you've proven the approach works on a smaller scale.
Sample size matters more than most shops assume. A single clean cycle tells you almost nothing, because it hides the variation caused by different operators, shift changes, and the small stoppages that happen constantly on a real floor. Measurement guidance from operations analysts recommends capturing 50 to 100 cycles across normal production conditions, not an idealized best case, before you trust the number enough to act on it.
Once you have that data, calculate three figures, not just one. The average tells you typical performance. The median filters out the effect of a few extreme outliers. The 85th percentile is the number that matters most when you're making a delivery promise or setting a standard, because it represents the time within which 85% of your cycles actually finish. Quoting customers or planners your average cycle time when your 85th percentile runs 30% higher is how shops end up chronically late.
Pro Tip: Post the 85th-percentile number, not the average, on your shop-floor board. Operators anchor to whatever number they see daily, and the 85th percentile keeps that anchor honest.
How Do You Break Cycle Time Down to Find the Real Losses?
Most operations leaders assume machining time is the biggest chunk of their cycle time. It usually isn't. Across shop environments, processing time often accounts for only 10 to 20 percent of total cycle time, with the rest consumed by queue time and waiting. That single fact should change where you point your improvement effort.
Cycle time loss generally falls into five categories, and each one requires a different fix:
- Queue and waiting time — parts sitting between operations, waiting for a machine, an operator, or a fixture.
- Changeover time — setup, tooling swaps, and program loading between jobs.
- Micro-stops — brief interruptions under a few minutes each: clearing chips, adjusting a fixture, checking a print.
- Speed loss — running below the machine's rated feed rate due to conservative programming or worn tooling.
- Unplanned downtime — breakdowns, tool failures, and unscheduled maintenance.
Speed loss and micro-stops get ignored constantly because no single instance looks significant. Stack them up, though, and they can account for 30 to 60 percent of the gap between a machine's actual output and its rated spec. That's often a bigger opportunity than chasing the next big breakdown.
Three analysis tools do most of the diagnostic work here. A process map lays out every step a part travels through, including moves and waits, so hidden queue time becomes visible instead of assumed. A cumulative flow diagram plots work entering and leaving a process over time. When the gap between the two lines widens, WIP is building up somewhere you haven't noticed. A Pareto analysis, run on minutes lost rather than incident count, tells you which loss category is actually worth attacking first.
| Loss category | Typical share of gap | Best diagnostic tool |
|---|---|---|
| Queue and waiting | Often the largest single category | Cumulative flow diagram, process map |
| Speed loss and micro-stops | 30 to 60% combined | OEE data, video review |
| Changeover time | Varies by batch size and part mix | SMED time study |
| Unplanned downtime | Varies by maintenance maturity | Downtime codes, Pareto by minutes |
When you rank losses by minutes, not by number of occurrences, you avoid the trap of fixing the loudest problem instead of the biggest one. A machine with twelve two-minute micro-stops a day loses more time than one dramatic 15-minute jam, even though the jam gets talked about in the morning meeting.
This is also where the Theory of Constraints earns its keep. Identify the actual bottleneck, exploit it fully before adding capacity anywhere else, and subordinate every other station's schedule to keep that constraint fed. Fixing a non-bottleneck station feels productive and rarely changes total throughput at all.
Pro Tip: Run your Pareto by minutes lost per shift, not by count of stoppages. A machine that stops eight times for 30 seconds each is bleeding more time than one dramatic 10-minute jam, but the jam is what everyone remembers.
What Are the Most Effective Ways to Reduce Cycle Time?
Once you know where the time is going, the fixes below are the ones that actually move the needle, in roughly the order most shops should try them.
- Control WIP with finite capacity scheduling. Cap how much work sits in front of any station instead of releasing every job the moment it's ready. Excess WIP doesn't speed anything up. It just hides the bottleneck under a pile of queued parts. Limiting WIP is often the single highest-leverage policy change available, because it costs nothing to implement and shows results within two to four weeks.
- Apply SMED to your worst changeovers. Single-Minute Exchange of Die breaks setup into internal steps (machine must be stopped) and external steps (can happen while the machine still runs). Moving even a few steps from internal to external, like staging tooling and pre-verifying programs before the last part finishes, routinely cuts changeover time by a third or more.
- Eliminate handoffs by creating single-ownership flows. Every time a part changes hands between departments, it waits. Cross-training operators to run a part through two or three consecutive operations removes that wait entirely.
- Overlap and sequence operations wherever the process allows it. Staging the next job's fixture while the current cycle runs, or running secondary deburring in parallel with the next part's machining, recovers minutes that would otherwise sit idle.
- Hunt micro-stops with video and OEE data. Recording a shift and reviewing it against OEE logs surfaces the small, repeated interruptions operators stop noticing because they've become routine. Video-plus-OEE analysis is one of the more underused diagnostic methods on the floor today.
- Move to condition-based maintenance. Reactive maintenance produces two kinds of loss: the obvious breakdown and the invisible speed loss from a machine running degraded for weeks before it fails outright. Monitoring vibration, spindle load, or coolant condition catches the slow decline before it becomes downtime.
- Pilot targeted automation and poka-yoke before jumping to full automation. A simple fixture, an automated part-presence sensor, or a poka-yoke that prevents incorrect loading often delivers better return than a six-figure robotic cell, particularly when your process still has variability that full automation would just lock in. Small, low-cost fixtures frequently outperform full automation when process maturity is still developing.
- Fix quality problems at the source instead of catching them downstream. Every rework loop adds a full extra pass through the process. A single dimension that's chronically out of tolerance can quietly double the effective cycle time on a part that looks fine on paper.
A few pitfalls trip up almost every shop attempting this for the first time:
- Cutting batch sizes without first reducing changeover time just multiplies the number of setups you're paying for.
- Cross-training without clear ownership creates confusion about who's accountable when a handoff goes wrong.
- Chasing full automation on a process that still has quality variability locks in defects at higher speed.
- Treating WIP caps as a one-time policy instead of a daily discipline lets queue time creep back within a month.
None of these tactics requires a capital project to test. That's the point. You can pilot WIP limits, run one SMED workshop, or set up a video review on a single machine inside a week, which is exactly what the next section walks through.
How Do You Run a 12-Week Cycle Time Reduction Pilot?
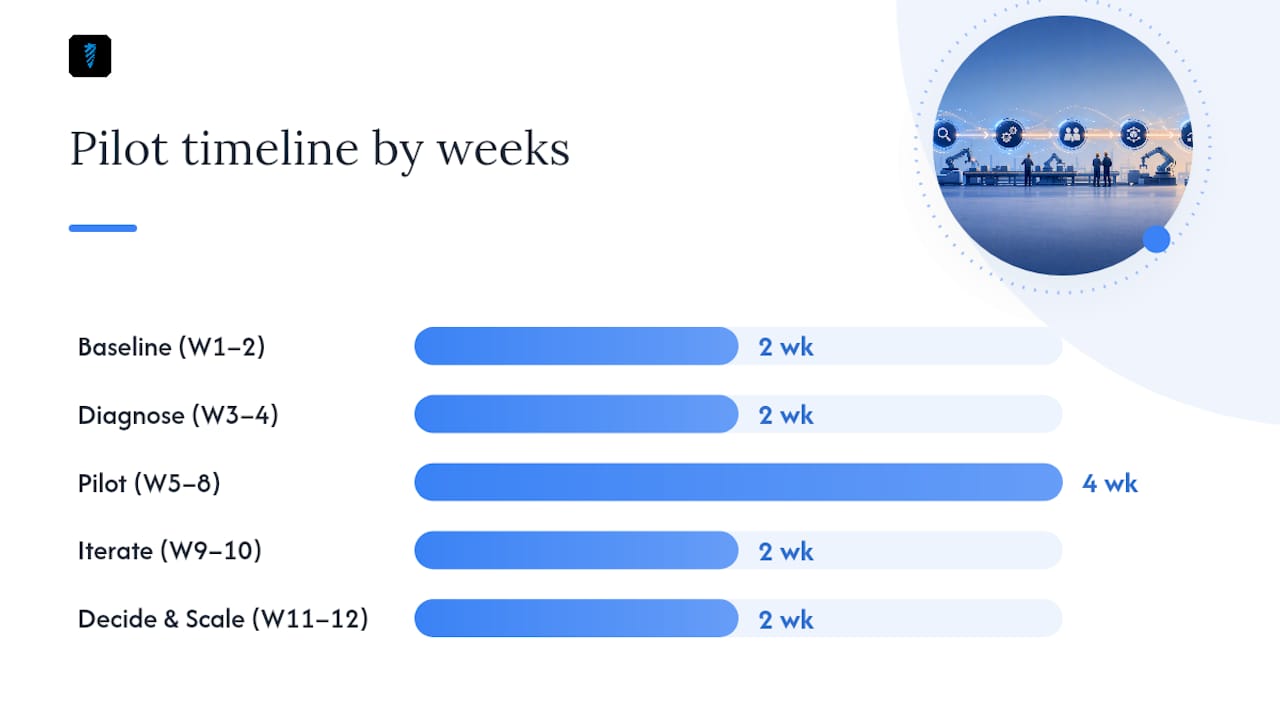
Scope the pilot to one machine or one cell, the one you already flagged as the bottleneck. Trying to fix cycle time across an entire shop at once dilutes attention and makes it impossible to tell which change caused which result. A focused 8 to 12 week window gives most teams enough time to measure, intervene, and see whether the change held.
- Weeks 1 to 2: Baseline. Assign an owner, usually the shift supervisor or process engineer closest to the machine. Capture 50 to 100 cycles under normal conditions and calculate average, median, and 85th percentile. Log every stoppage with four fields: machine, start time, duration, and reason code.
- Weeks 3 to 4: Diagnose. Build the Pareto by minutes lost. Confirm whether queue time, changeover, micro-stops, or downtime dominates. Pick one or two interventions, not five.
- Weeks 5 to 8: Pilot. Implement the WIP cap or SMED changes on that single cell only. Hold a daily five-minute stand-up at the visual board to review yesterday's cycle numbers and any new stoppages.
- Weeks 9 to 10: Iterate. Adjust based on what the data shows. A WIP cap set too tight starves the machine; too loose and queue time creeps back.
- Weeks 11 to 12: Decide and scale. Compare the new 85th-percentile cycle time against baseline. If the gain holds for two consecutive weeks, document the new standard and plan the rollout to the next cell.
Governance doesn't need to be heavy to work. A visual board at the machine showing yesterday's actual cycle time against target catches drift before it becomes a trend. A weekly 20-minute review with the pilot owner and a plant leader keeps the project from quietly stalling. Set one clear escalation rule up front: if cycle time worsens for three consecutive days, the pilot pauses until someone investigates, rather than letting a bad week get explained away.
For the ROI conversion, keep it simple. Multiply the minutes saved per cycle by the number of cycles run per week to get hours saved. Convert those hours to additional units produced at the existing rate, then value that throughput against your standard margin per part. It's real additional capacity you didn't have to buy equipment for.
Pro Tip: Set your acceptance criteria before the pilot starts, not after you see the results. Decide in week one what percentage improvement counts as success, or you'll end up rationalizing whatever number you get.
Which KPIs Keep Cycle Time Gains From Sliding Back?
A weekly dashboard with six numbers is enough to catch most regressions before they become a pattern: average cycle time, 85th-percentile cycle time, throughput (units per shift), active WIP count, average changeover time, and micro-stop count per shift.
Put these on a physical or digital board at the cell, not buried in a monthly report nobody reads until it's too late. The most effective boards show a simple trend line for the 85th percentile against the target line, updated daily, so drift is visible within days rather than discovered at month-end.
Statistical process control adds a layer most shops skip and shouldn't. Set upper and lower control limits around your new baseline cycle time using standard SPC methods, and treat any point outside those limits as a signal worth investigating immediately, not a fluke to shrug off.
WIP changes in particular need patience paired with vigilance. Effects on cycle time from adjusting WIP limits typically show up within two to four weeks, which is exactly why weekly checks, not daily ones, are the right cadence for judging whether a WIP policy change is working.
The most common sustainment trap isn't a data problem. It's a people problem: the pilot team moves on to the next project, the visual board stops getting updated, and WIP caps quietly erode back to "whatever fits." Three habits prevent that:
- Assign a named owner for the dashboard after the pilot ends, not just during it.
- Review the trend at the same recurring meeting every week, even after results stabilize.
- Re-baseline every quarter. Tooling wears, operators change, and last year's target may no longer reflect reality.
Where Do Calculators and Trackers Fit Into a Cycle Time Pilot?
Diagnosis is only half the job. Verifying that a fix actually worked, and worked without introducing a new problem, is where a lot of pilots quietly fall apart. That verification step is where calculator-style tools shorten the loop considerably.
A feeds-and-speeds check catches the gap between a conservative legacy program and what the tool and material can actually support, often the fastest legitimate speed-loss fix available. A tool deflection calculation flags whether a faster feed rate will cost you tolerance before you burn a part finding out the hard way. A G-code sanity check catches wasted rapid moves and inefficient toolpaths that quietly inflate machine-start-to-machine-start cycle time.
On the shop-management side, a maintenance log that captures the same four fields recommended for downtime tracking, machine, start time, duration, and reason code, turns "the mill's been acting up" into an actual Pareto chart by week three. A tool crib system with low-stock alerts prevents one of the most common and most avoidable causes of changeover delay: waiting on an insert that should have been reordered a week earlier.
The gap between a good pilot and a forgotten one is usually verification, not diagnosis. Teams find the bottleneck constantly. Fewer confirm the fix held two weeks later with the same rigor they used to find the problem in the first place.
A typical experiment workflow looks like this: log the baseline cycle in a job tracker tied to the part number, run the feeds-and-speeds and deflection checks before adjusting the program, make one change at a time, and compare the new cycle data against baseline using the same 85th-percentile method from week one.
Why Does Workforce Training Change Cycle Time Outcomes?
The best WIP policy and the sharpest Pareto analysis fail if the people running the machine don't understand or trust why the change is happening. Operators who see a WIP cap as management second-guessing their judgment will quietly work around it, and queue time creeps right back within a few weeks.
Training that actually moves cycle time numbers focuses on three things: teaching operators to recognize and log micro-stops instead of just absorbing them as normal, giving supervisors the authority to adjust WIP limits within a defined range instead of escalating every exception, and cross-training so a single-ownership flow is physically possible rather than a plan on paper that nobody can execute.
Engagement matters as much as skill. Shops that post cycle-time trends where operators actually see them, and explain the reasoning behind a target rather than just issuing it, tend to get faster buy-in on changeovers and WIP discipline. An operator who understands that a tighter WIP cap protects the bottleneck, not their own workload, is far more likely to flag a queue building up before it becomes a three-day backlog.
The training investment that pays off fastest is usually the simplest: teaching every operator on a pilot cell the same start/stop definition for cycle time, so the data feeding your Pareto chart is trustworthy from day one instead of six different people's interpretations of "done."
How Does Shop Floor Layout Affect Cycle Time?
Distance is time you're not getting back. A part that travels 40 feet between deburring and inspection loses more cycle time to that walk than most shops account for, because nobody times the walk, only the machining.
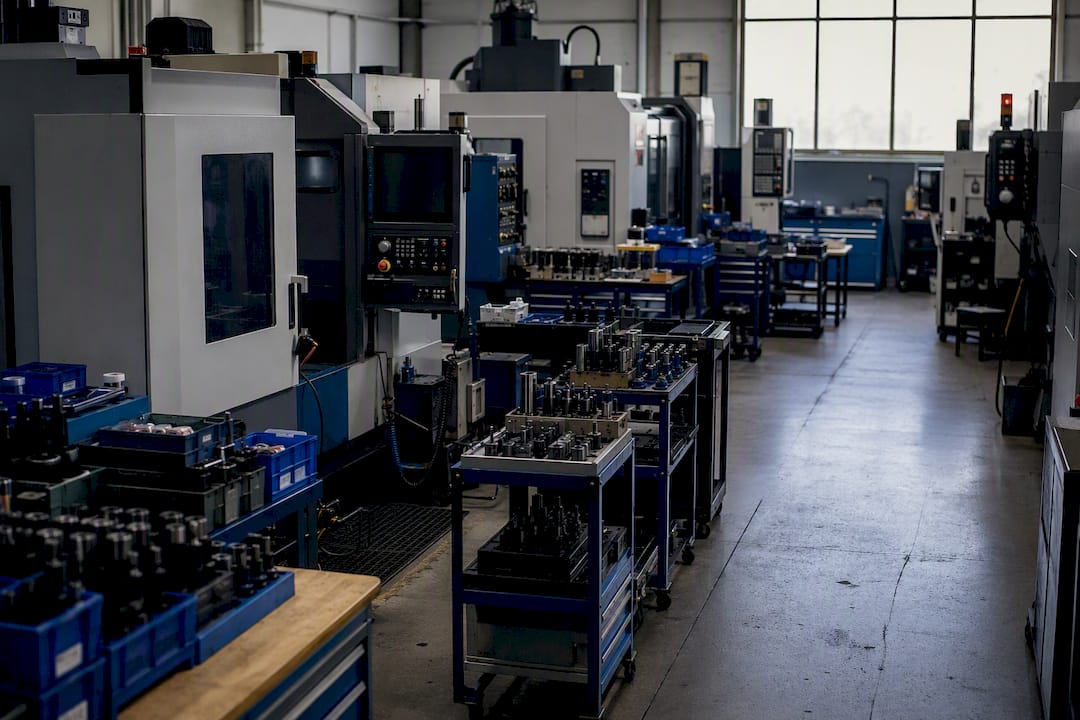
Cellular layouts, grouping the machines and workstations a part actually visits into one physical cluster, cut this hidden travel time by design. Compare that to a traditional layout organized by machine type, where every job zigzags across the floor visiting the mill department, then the deburring station, then inspection, wherever those happen to sit.
Layout also affects changeover time directly. Tooling, fixtures, and gauges staged more than a short walk from the machine add minutes to every setup, minutes that SMED's "external steps" principle is specifically designed to eliminate. A well-designed workspace keeps everything needed for the next changeover within arm's reach, staged before the current job finishes.
Point-of-use storage for common tooling, rather than a centralized crib on the other side of the building, is one of the simplest layout wins available. It won't fix a fundamentally broken process, but it removes friction from every single cycle, which adds up faster than most shops expect once you multiply it across a full shift.
Can Simulation and Analytics Tools Improve Cycle Time Optimization?
Discrete-event simulation lets you test a WIP cap, a new sequencing rule, or an added shift before committing real production time to the experiment. For a bottleneck feeding multiple downstream operations, simulating three or four WIP levels in software surfaces the sweet spot faster than trial-and-error on the actual floor, where each iteration costs real cycles.
Analytics dashboards that pull cycle data automatically from machine controls remove the labor of manual timestamping once a pilot proves the concept and you're ready to scale monitoring across more machines. That's a meaningful step up from a clipboard, but it's not where a first pilot should start. The manual approach forces a team to understand its own process before automating the measurement of it.
The realistic role for advanced analytics in most job shops isn't predictive modeling replacing human judgment.
Simulation and analytics amplify a good measurement foundation. They don't replace the two-week baseline and the honest Pareto analysis described earlier. A shop that jumps straight to modeling software without first getting its own timestamp discipline right is modeling noise, not reality.
What I've Learned Running Cycle Time Pilots
The friction is rarely technical. It's political. Operators who've been burned by a previous "efficiency initiative" that turned into a headcount conversation will slow-walk a WIP cap no matter how sound the math is. The fix isn't a better spreadsheet. It's picking one cell, being transparent about what the pilot is and isn't for, and letting the first two weeks of honest data do the convincing instead of a management memo.
Small pilots beat sweeping rollouts because they're reversible. A shop that tries to cut WIP across six cells simultaneously has no way to isolate what worked when results are mixed, and mixed results kill momentum fast.
No new equipment. Just discipline, applied to one machine, measured honestly.
How Availzye Machinist Pro Supports Your Cycle Time Pilot
The playbook above works with a clipboard and a spreadsheet. It works faster with the right tools built for exactly this job. Availzye Machinist Pro pairs precision calculators with shop-management features so you can run the diagnosis and the verification without switching between four disconnected systems.

When you're chasing speed loss, the feeds and speeds tools and tool deflection calculator tell you whether a faster program is safe before you commit a part to it. When changeover time is your biggest Pareto bar, the Tool Crib inventory system with low-stock alerts stops a missing insert from turning a 20-minute setup into a two-hour scramble. The Maintenance Tracker logs the same four fields, machine, start time, duration, reason code, that a solid downtime program needs, and the Job Tracker keeps your baseline and pilot cycle data attached to the actual work order instead of a loose notebook.
Your first trial step doesn't need to be complicated: instrument one bottleneck machine, run a four-week experiment tracking cycle time against the Maintenance Tracker's downtime log, and see what the Pareto tells you. Start your seven-day free trial and set up your first machine today.
Sources
- Manufacturing Cycle Time: Calculation, Benchmarks, and Reduction Strategies | RMDB by User Solutions
- How to Measure and Reduce Cycle Time: A Complete Guide to Process Improvement - Lean 6 Sigma Hub
- Cycle time efficiency: a data-driven approach for operations leaders | Guidewheel