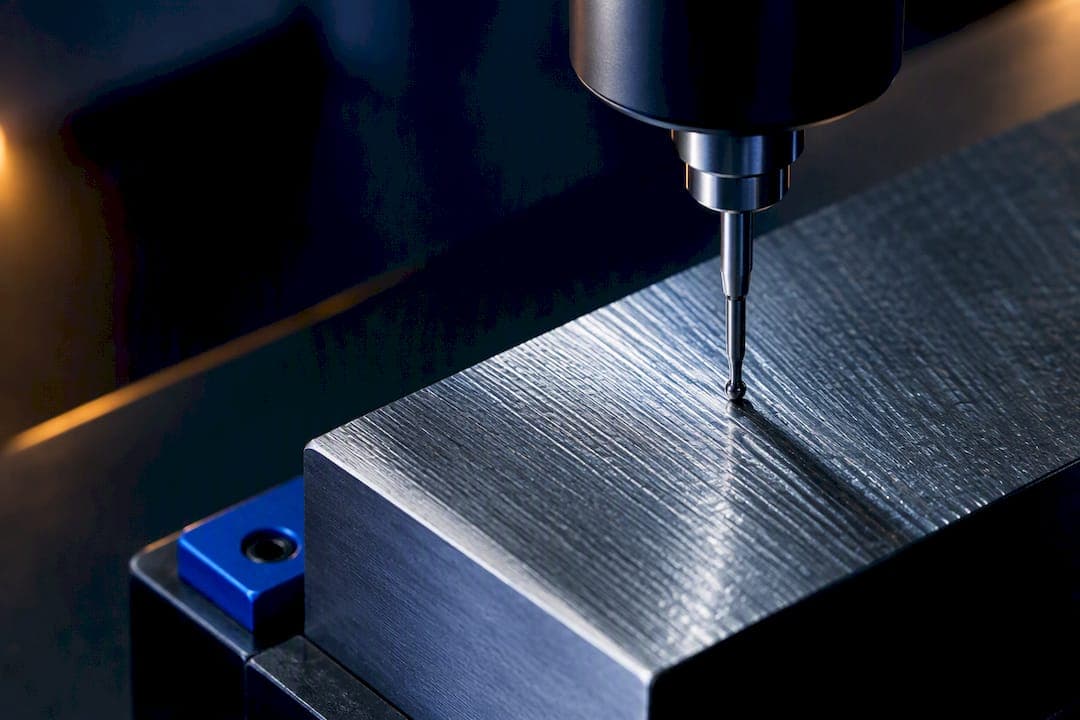
Waviness is the long-wavelength component of a surface profile, and roughness is the short-wavelength component. A filter cutoff chosen during measurement separates the two, so the same physical surface can report different Ra and waviness values depending on that setting. Meeting an Ra specification alone never confirms that waviness is under control, and parts have failed in service despite passing roughness checks.
TL;DR:
- Waviness measurements are highly sensitive to filter cutoff settings and can reveal long-wavelength deviations that roughness parameters like Ra may overlook.
- Changing the cutoff wavelength shifts features between the waviness and roughness domains, affecting the reported parameters and their interpretation.
- Waviness causes functional issues such as leaks, vibrations, or uneven wear even when roughness meets specifications, especially on sealing surfaces and rotating parts.
- Proper measurement requires documenting filter settings, evaluation length, instrument type, and ensuring calibration against reference standards for accuracy and comparability.
- Surface finish assessments must consider both domains and their measurement context to reliably predict part performance and prevent failures.
Table of Contents
- Waviness vs roughness at a glance
- Understanding profile, form, waviness, and roughness
- How filtering and cutoff wavelengths define each domain
- Reading Ra, Rq, Rz, Wt, and the other common parameters
- Choosing between stylus and optical measurement methods
- When waviness, not roughness, causes the failure
- A step-by-step workflow for measuring and reporting both domains
- Shop-floor best practices and common measurement pitfalls
- How surface texture analysis developed over time
- Where waviness and roughness matter beyond sealing and wear
- Two-dimensional profiles versus three-dimensional areal measurement
- Calibration standards and reference specimens for accurate measurement
- Environmental factors that skew surface measurements
- How we think about this at Availzye
- Sources
- FAQ
Waviness vs roughness at a glance
A surface profile contains three nested layers: form (the intended overall shape), waviness (periodic or irregular deviations longer than the roughness cutoff), and roughness (the finer texture left by the machining process itself). Which wavelengths count as roughness versus waviness depends entirely on the filter cutoff applied during analysis, not on some fixed physical boundary. Illustrative cutoff ranges commonly separate short-wavelength roughness from longer waviness content, though the actual values depend on the part, the process, and the applicable standard.
- Profile: the raw, unfiltered trace captured by the instrument.
- Form: the intended macro-geometry, such as flatness or roundness.
- Roughness: fine texture from the cutting or finishing process, described by parameters like Ra, Rq, and Rz.
- Waviness: longer-period deviations, described by Wt and Wa, often linked to vibration, fixturing, or thermal effects.
| Parameter | Domain | What it signals |
|---|---|---|
| Ra | Roughness | Average deviation from the mean line |
| Rq | Roughness | Root-mean-square deviation, more sensitive to outliers |
| Rz | Roughness | Peak-to-valley height, sensitive to isolated defects |
| Wt | Waviness | Total waviness height across the evaluation length |
| Wa | Waviness | Average waviness deviation from the mean line |
Waviness deserves its own callout on drawings for sealing surfaces, rolling element bearing races, and any rotating part where noise or vibration is a concern, since roughness parameters alone can miss the deviations that cause those failures.
Understanding profile, form, waviness, and roughness
Surface metrology uses a set of prefixes to keep these layers distinct on a drawing or in a measurement report. The primary profile, labeled P, is the raw trace before any filtering. The roughness profile, labeled R, is what remains after form and waviness have been filtered out. The waviness profile, labeled W, sits between the two: longer than roughness, shorter than the intended form.
These profiles are nested by wavelength, not by any inherent physical difference. NIST's explanation of the P, R, and W prefixes makes clear that profile requirements are broader than a single Ra number, and that the same surface can be described very differently depending on which profile is analyzed.
- P-profile: the unfiltered, primary trace containing form, waviness, and roughness together.
- R-profile: the roughness component, isolated by removing longer wavelengths.
- W-profile: the waviness component, isolated by removing both form and roughness.
- The boundary between these layers moves whenever the filter cutoff changes, which is why two labs can report different numbers from the same part.
Because the split is measurement-dependent, a roughness or waviness value only means something when it comes with the settings that produced it.
How filtering and cutoff wavelengths define each domain
Instruments separate roughness from waviness using a Gaussian or phase-correct filter, applying a long cutoff wavelength (λc) to strip out waviness and form, and a short cutoff (λs) to remove noise and non-relevant fine detail. Everything between λs and λc is reported as roughness. Everything longer than λc, up to the evaluation length, becomes waviness.
Changing λc changes the result. Lowering the cutoff pulls more content into the waviness domain and reduces the reported Ra, while raising Wt, because content that was previously averaged into roughness now shows up as longer-period deviation instead.
Documented example: NIST's measurement guidance describes how evaluation length, sampling interval, and filter cutoff all shift measurement uncertainty, which is why standards require these settings to be recorded alongside any Ra or Wt value rather than reported on their own.
- Evaluation length must be long enough to capture several waviness cycles, or the waviness estimate becomes unreliable.
- Sampling interval must be fine enough to resolve the shortest roughness features of interest.
- Filter type (Gaussian versus phase-correct) affects how sharply the boundary between domains is drawn.
ASME B46.1 provides customary cutoff tables tied to roughness spacing, and explicitly warns that changing the cutoff reclassifies height features between the R and W domains. NIST's surface finish tutorials and current ISO 21920 guidance follow the same logic: report the filter and the numbers become comparable, omit it and they do not.
Reading Ra, Rq, Rz, Wt, and the other common parameters
Ra, the arithmetic mean deviation of the roughness profile from its mean line, is the most quoted parameter on shop drawings because it is simple and repeatable. Rq is the root-mean-square version of the same idea, and because squaring the deviations, it reacts more strongly to occasional large peaks or valleys than Ra does. NIST's height parameter definitions note that Rz conventions differ between ISO and ASME, so a value labeled Rz from one lab is not automatically comparable to one from another without checking which standard applies. Rt captures the total profile height across the full evaluation length, catching defects that an average parameter can smooth over.
Wt and Wa mirror Ra and Rt but in the waviness domain: Wt is the total waviness height, Wa the average waviness deviation.
- Ra and Wa describe distributed texture well but can hide isolated defects.
- Rz and Rt react strongly to individual peaks or valleys, which makes them useful for catching outliers Ra misses.
- Rq sits between the two, weighting large deviations more than Ra without being as extreme as Rz or Rt.
Request Rz or Rq alongside Ra whenever a surface has a functional risk from isolated scratches or pits, and add Wt or Wa whenever the part's function depends on longer-period flatness, such as a sealing face or a bearing raceway. Two surfaces with the same Ra can behave completely differently once waviness or peak distribution is taken into account, which is exactly why a single number rarely tells the whole story.
Choosing between stylus and optical measurement methods
Stylus profilometers drag a diamond tip across the surface and remain the most established method for roughness and waviness measurement, but the stylus tip radius sets a physical limit on the smallest features it can resolve, and contact pressure can mark soft materials. Calibration against traceable standard reference materials keeps stylus results comparable across labs.
Optical and areal methods, including confocal microscopy and fringe projection, scan a wider area without contact and can reveal waviness patterns, such as lobing, that a single stylus trace across a narrow path might miss entirely. A 2023 comparison of optical and stylus methods published in Materials found that fringe projection produced lower Ra values than stylus measurement on as-built additive manufacturing surfaces, a method-dependent gap driven by resolution, tip penetration, and data coverage rather than any defect in either instrument.
- Stylus methods offer high vertical resolution along a line but limited area coverage per pass.
- Optical and areal methods cover more surface area quickly but can smooth fine detail depending on point density.
- Method choice should match the feature size of concern: line profiles for isolated scratches, areal scans for lobing or periodic waviness across a face.
Pro Tip: When a part's history moves between stylus and optical measurement, note the method on the record: a changed number can mean a changed instrument, not a changed part.
When waviness, not roughness, causes the failure
A part can pass its Ra callout and still leak, vibrate, or wear prematurely, because the failure mode lives in the waviness domain rather than the roughness domain. Quality Magazine documented cases where sealing surfaces met their Ra specification yet still leaked, and the root cause only surfaced once the trace was filtered to isolate waviness rather than roughness.
- Sealing surfaces: a smooth Ra reading can coexist with a long, shallow wave that breaks the seal line.
- Rotating parts: periodic waviness, or lobing, on a shaft or bore can generate audible noise or vibration that a static Ra check never flags.
- Coated and wearing surfaces: long-wavelength deviations concentrate load unevenly, accelerating wear or coating failure well before a roughness spec would predict it.
Add a waviness requirement whenever the part seals, rotates, or carries a coating, and choose the cutoff based on the part's functional wavelength rather than a default setting.
A step-by-step workflow for measuring and reporting both domains
A reproducible result starts with a documented plan, not a single number pulled off a screen.
- Define the function first. Decide whether sealing, rotation, wear, or appearance drives the requirement, then choose cutoffs and evaluation length that match ASME B46.1 or ISO guidance for that application.
- Remove form. Record whether form was removed by least-squares fitting, a reference datum, or another method, since this choice changes the resulting waviness profile.
- Select the instrument and settings. Note stylus tip radius for contact measurement, or resolution and point spacing for optical and areal scans.
- Apply the filter and calculate parameters. Compute Ra, Rq, Rz, Wt, and Wa as needed, and log the filter type, λc, λs, evaluation length, and sampling interval alongside every value.
- Interpret in context. Compare results against the functional requirement, not just the number on the drawing, and flag any surface where waviness and roughness tell different stories.
Pro Tip: Put the filter cutoff and evaluation length directly on the engineering drawing next to the Ra callout: a number without its settings is not a specification, it is a guess.
Availzye Machinist Pro's surface finish calculator supports this kind of parameter work directly from the shop floor, and its Ra vs Rz guide walks through the tradeoffs between those two parameters in more depth.
Shop-floor best practices and common measurement pitfalls
Most disputes over a "bad" surface finish trace back to mismatched settings rather than an actual defect. Always report the filter cutoff, evaluation length, sampling interval, and instrument type alongside any Ra or Wt value, and never compare two readings unless all four match.
- Never compare Ra values taken with different cutoffs or different instrument classes as though they were interchangeable.
- Watch for stylus tip rounding on fine features and optical smoothing on high-density scans, both of which quietly understate roughness.
- If function depends on waviness, specify the waviness parameter, the cutoff, and the evaluation length together, not the parameter alone.
- Re-measure with matched settings before rejecting a part on a surface finish dispute.
Pro Tip: Before rejecting a part for a borderline Ra reading, check whether the reference measurement used the same cutoff and instrument: a mismatch is a common source of false rejects.
How surface texture analysis developed over time
Surface texture measurement began as a largely visual and tactile trade, with machinists judging finish by feel and comparison blocks rather than instruments. Mechanical stylus profilometry emerged as a practical laboratory tool in the mid-twentieth century, giving engineers a repeatable trace of a surface for the first time rather than a subjective impression.
Early roughness reporting relied on simple average height calculations without a formal separation between roughness and waviness, which meant that vibration-driven waviness and process-driven roughness were often lumped into a single number. As precision manufacturing in aerospace and bearing production matured, the need to separate these domains became clear, and filtering methods were introduced to draw a defined boundary between them.
NIST's surface finish metrology tutorial traces this development, noting that roughness is usually tied to the basic manufacturing process while waviness often stems from machine vibration or chatter, a distinction that shaped how filtering standards evolved. Standards bodies including ASME and the ISO 4287 and now ISO 21920 family formalized the P, R, and W profile system, along with standardized cutoff tables, replacing ad hoc lab practices with common measurement conditions. The move from two-dimensional line profiles to three-dimensional areal measurement in more recent decades reflects the same push: catching texture and waviness patterns that a single line trace could never fully represent, and giving engineers a shared language for describing a surface regardless of which lab measured it.

Where waviness and roughness matter beyond sealing and wear
Sealing and wear are the most commonly cited failure modes, but surface texture requirements extend across manufacturing sectors that never mention a gasket. In aerospace, turbine blade surfaces need controlled roughness for aerodynamic efficiency and fatigue life, while waviness on mating flange faces affects fastener preload and fit.
Automotive applications lean on both domains for different reasons: cylinder bore roughness affects oil retention and piston ring wear, while waviness on brake rotor faces can generate the pulsation drivers feel as pedal vibration. Bearing raceways in both aerospace and automotive contexts depend on tightly controlled waviness because periodic deviations at rotational frequency translate directly into vibration and noise.
Electronics manufacturing brings its own version of the same problem. Semiconductor wafer flatness and surface texture affect lithography accuracy, and connector contact surfaces need controlled roughness to maintain consistent electrical contact resistance over repeated mating cycles. Optical components add another layer, where waviness across a lens or mirror surface distorts wavefronts in ways that a roughness spec alone would never catch.
Across these industries the underlying principle stays constant: roughness governs friction, wear, and local contact behavior, while waviness governs fit, vibration, and larger-scale functional geometry. A specification that only addresses one domain leaves the other unmanaged, regardless of whether the part sits in a jet engine, a car door, or a circuit board connector.
Two-dimensional profiles versus three-dimensional areal measurement
A traditional 2D profile measurement captures a single line trace across the surface, producing Ra, Rz, Wt, and related parameters along that one path. This approach is fast and well understood, but it can miss directional patterns, such as lobing or periodic waviness, that only become visible when a wider area is examined.
Three-dimensional areal measurement, using confocal or fringe projection systems, scans a grid or a stitched region instead of a single line, producing areal parameters that describe the surface as a whole rather than one slice of it. The 2023 Materials comparison of optical and stylus methods found that areal and stylus techniques can disagree on Ra and Rt for the same part, driven by differences in point density, resolution, and how much of the surface each method actually samples.
- 2D profiles are faster, cheaper, and sufficient when the surface texture is uniform and non-directional.
- 3D areal scans reveal periodic waviness, lobing, and localized defects that a single 2D trace can miss entirely.
- Point density and coverage in areal scans determine whether fine roughness features are resolved or smoothed away.
For parts where waviness direction matters, such as a sealing face machined with a spiral tool path, areal measurement gives a far more complete picture than a handful of 2D line traces ever could. The tradeoff is longer measurement time and more complex data processing, which is why many shops reserve areal scanning for functionally critical surfaces rather than routine inspection.
Calibration standards and reference specimens for accurate measurement
Every roughness or waviness number is only as trustworthy as the calibration behind the instrument that produced it. Standard reference specimens, machined or certified to a known Ra, Rz, or Wt value, let labs verify that a profilometer or optical system reports the correct value before it is trusted on production parts.
NIST's calibration guidance describes how stylus radius, sampling interval, and filter settings all contribute to measurement uncertainty, and recommends the use of standard reference materials along with documented stylus tip corrections to bound that uncertainty. A stylus that has picked up wear on its tip will report artificially smoothed roughness values, which is why periodic recalibration against a certified specimen catches drift before it corrupts a batch of inspection records.
- Certified reference specimens establish a traceable baseline for Ra, Rz, or Wt before production measurement begins.
- Stylus tip radius should be verified and documented, since a worn or oversized tip understates fine roughness features.
- Optical systems require their own calibration routine, typically against a certified step height or roughness standard, since their resolution depends on different physics than a mechanical stylus.
- Recalibration on a defined schedule catches instrument drift before it shows up as a false pass or false reject on a production part.
Calibration is not a one-time event: an instrument that passed acceptance testing a year ago can drift enough to shift Ra readings outside an acceptable band, especially in shops where the same gauge sees heavy daily use.
Environmental factors that skew surface measurements
Temperature, vibration, and contamination all introduce noise into a measurement long before the filter and cutoff settings ever come into play. A stylus profilometer sitting near a CNC machine in operation can pick up floor vibration as false waviness, inflating Wt readings on a surface that is actually flat.
Thermal drift affects both the part and the instrument: a part measured warm from machining will show different dimensions than the same part measured after it cools, and optical systems can lose focus accuracy if ambient temperature shifts during a scan. Airborne particulates and coolant residue on the surface being measured can register as spurious peaks on a stylus trace or as noise on an optical scan, distorting both roughness and waviness results.
- Isolate measurement stations from machine vibration using dedicated benches or vibration-damping mounts.
- Allow parts to reach a stable ambient temperature before measurement, particularly for tight waviness tolerances.
- Clean surfaces of coolant, chips, and residue before measurement to avoid false peaks in the trace.
- Control humidity where optical systems are sensitive to atmospheric refractive index changes over long scan times.
None of these factors show up in a reported Ra or Wt value, which is exactly why they are easy to overlook until two measurements of the same part disagree for no apparent reason. A consistent measurement environment matters as much as the instrument settings themselves.
How we think about this at Availzye
Building calculation tools for machinists means living inside exactly this problem: an Ra number without its measurement context tells a shop very little. Availzye Machinist Pro's surface finish calculator handles the parameter math, and the Job Tracker gives a place to log which cutoff, evaluation length, and instrument settings went with each measurement, so a part's finish history stays attached to its work order rather than scattered across separate inspection sheets.
That recordkeeping habit is what turns a one-off Ra reading into a comparable, defensible measurement months later. If you want to run the numbers yourself, the surface finish calculator is built for exactly that.
This section reflects Availzye's own product and does not constitute independent testing or certification of measurement accuracy.
— Availzye
Sources
- NIST: Surface parameters — Height parameters
- NIST: Surface roughness and step height calibrations (measurement conditions and sources of uncertainty)
- Hidden waviness: When measuring roughness cannot solve quality challenges — Quality Magazine (2020)
- Comparison of Optical and Stylus Methods for Surface Texture Characterisation — Materials (2023)
FAQ
What's the difference between Ra and Rz?
Ra is the arithmetic mean deviation of a roughness profile from its mean line, while Rz measures peak-to-valley height and reacts more strongly to isolated high or low points. NIST notes that Rz conventions differ between ISO and ASME, so the same surface can report different Rz values depending on which standard was applied.
What is the 16 rule for surface roughness?
Definitions of this rule vary by industry and drawing standard, and no single authoritative source in this article defines a universal "16 rule." Consult the surface finish requirements referenced on the specific engineering drawing or the applicable ASME or ISO standard for the governing convention in that context.
What is the difference between surface profile and surface roughness?
A surface profile is the raw, unfiltered trace of the surface, often called the primary or P-profile, containing form, waviness, and roughness combined. Roughness is a filtered subset of that profile, isolating only the short-wavelength texture after form and waviness have been removed.
Is roughness the same as smoothness of a surface?
Roughness is a measured property describing deviations from a mean line, typically reported as Ra, Rq, or Rz, while smoothness is a general, non-technical term people use to describe the same idea informally. A lower Ra value generally corresponds to what most people would call a smoother surface, but smoothness alone does not capture waviness, which can affect function even when a surface feels smooth to the touch.
Can a part pass its Ra specification and still fail in service?
Yes, because Ra alone says nothing about waviness, and documented cases show sealing surfaces that met their Ra callout yet still leaked until waviness was measured and controlled separately. Functional specifications for sealing, rotating, or coated surfaces should include waviness parameters alongside roughness rather than relying on Ra by itself.