
A tolerance stack up is the accumulated variation across a chain of part dimensions that determines whether an assembly will fit and function as designed. For most production scenarios, start with RSS (root-sum-square) analysis once you've confirmed process capability (Cpk ≥ 1.33); fall back to worst-case for safety-critical or low-volume assemblies where every unit must fit unconditionally; and use Monte Carlo when distributions are non-normal or the assembly geometry is too complex for closed-form math.
The method you choose isn't just a statistical preference. It directly determines how tight your tolerances need to be, which drives machining cost, scrap rate, and supplier pricing. Get it wrong in the conservative direction and you're paying for precision you don't need. Get it wrong in the optimistic direction and you're reworking assemblies on the floor.
Table of Contents
- What is tolerance stack-up and why does it cost you money?
- Which analysis method should you use: worst-case, RSS, or Monte Carlo?
- How to run a tolerance stack-up from scratch
- Worked example: worst-case, RSS, and Monte Carlo for a simple gap
- How to find which dimensions are actually driving your stack
- What tools should you use for tolerance stack-up analysis?
- Shop-focused best practices and mistakes that cost you rework
- Which method fits your situation? A quick decision guide
- Key Takeaways
- The case for doing tolerance analysis earlier than you think
- Availzyemachinistpro puts tolerance analysis where you actually work
- Useful sources and further reading
What is tolerance stack-up and why does it cost you money?
Every part in an assembly carries dimensional variation. When those parts mate, their individual tolerances combine, and the result is a functional gap, clearance, or interference that either falls within your design requirement or doesn't. That chain of contributing dimensions is the stack loop, and tracing it correctly is the foundation of any valid analysis.
The practical stakes are straightforward:
- Assembly failures caused by interference or insufficient clearance that wasn't predicted at the design stage
- Rework and scrap when parts are made to drawing but won't assemble, because the drawing tolerances weren't analyzed as a system
- Over-tight tolerances that inflate per-part cost without improving functional performance
- Warranty and field failures when statistical assumptions were applied to processes that weren't actually in control
Tight tolerances cost disproportionately more than loose ones. A tolerance of ±0.001" on a turned diameter might require grinding instead of turning, a different fixturing setup, and 100% inspection. If sensitivity analysis shows that dimension contributes only 4% of total stack variance, you've paid a premium for essentially nothing. The right approach is to run the analysis first, identify which contributors actually drive variation, and only tighten where it matters.
ASME Y14.5 is the governing standard for dimensioning and tolerancing in the United States. It defines how geometric tolerances are specified and interpreted, and a valid stack-up analysis depends on reading those callouts correctly. Process capability metrics like Cpk quantify how well a manufacturing process holds a given tolerance, and they're the bridge between what the drawing says and what the shop actually produces.
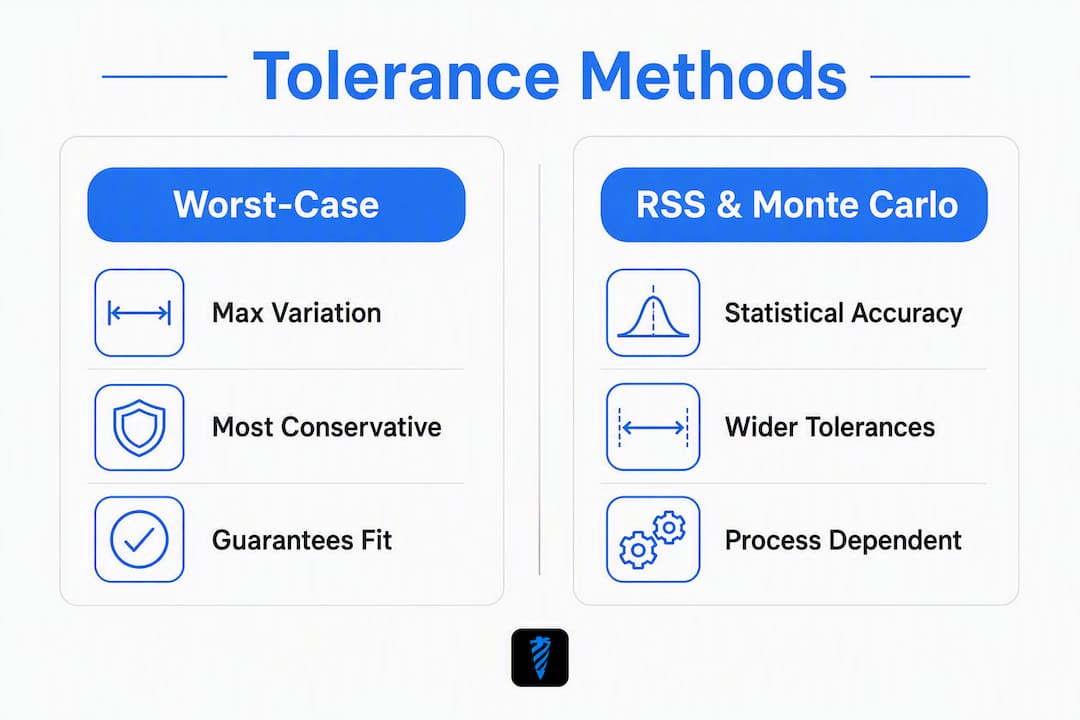
Which analysis method should you use: worst-case, RSS, or Monte Carlo?
Three methods cover the vast majority of real-world stack-up analysis. Each makes different assumptions, produces different predicted ranges, and carries different cost implications.

Worst-case (arithmetic) method
The worst-case sum adds the absolute value of every contributing tolerance:
T_total = T₁ + T₂ + T₃ + … + Tₙ
Every part simultaneously hits its extreme limit in the worst possible direction. That scenario is physically possible but statistically rare. Worst-case guarantees fit for every unit ever assembled, which is exactly what you need for a safety-critical joint, a medical device, or a low-volume aerospace component where a single failure is unacceptable. The cost: tolerances are often far tighter than necessary for high-volume production, because the method assumes the worst combination will actually occur.
RSS (root-sum-square) method
RSS treats each contributor as an independent, normally distributed random variable and combines them by square root of the sum of squares:
T_RSS = √(T₁² + T₂² + T₃² + … + Tₙ²)
The result is significantly smaller than the worst-case sum, which translates directly to wider allowable tolerances on individual parts. RSS results are interpreted using σ coverage: a 3σ result covers approximately 99.73% of assemblies, while automotive and medical applications often target 4σ or 6σ depending on acceptable defect rates.
The critical constraint: RSS is only valid when your manufacturing processes are stable and independent. If shop processes have Cpk below 1.33, RSS assumptions break down and yield predictions will be optimistic. Verify capability before you rely on statistical results for production sign-off.
Monte Carlo simulation
Monte Carlo generates thousands of virtual assemblies by randomly sampling each dimension from its assigned distribution, then tallies how many fall outside the functional requirement. It's the most realistic approach for complex assemblies because it isn't limited to normal distributions or linear stack loops. You can assign skewed, uniform, or empirical distributions to individual contributors and model real process behavior.
Practical Monte Carlo runs typically use a large number of trials; increasing the number generally stabilizes results and improves estimation confidence, with common practice favoring several thousand trials for reliable outcomes.
Method comparison at a glance
| Criterion | Worst-Case | RSS | Monte Carlo |
|---|---|---|---|
| Predicted variation | Largest (most conservative) | Moderate | Most realistic |
| Guarantee of fit | 100% (all units) | Statistical (e.g., 99.73% at 3σ) | Probability-based |
| Process data required | None | Cpk ≥ 1.33, normal distribution | Distribution data per contributor |
| Best for | Safety-critical, low-volume | High-volume production, stable processes | Complex geometry, non-normal distributions |
| Tolerance cost impact | Highest | Moderate | Depends on inputs |
How to run a tolerance stack-up from scratch
A repeatable workflow matters more than any single formula. Here's the process from functional requirement to documented result.
-
Define the functional requirement. State the gap, clearance, or interference you're controlling, its nominal value, and the minimum/maximum limits that define success. Everything downstream serves this requirement.
-
Trace the stack loop. Walk the physical assembly path from one datum surface to the other, touching only the mating surfaces that actually contribute to the functional gap. Including non-contributing drawing dimensions inflates calculated variance and produces a pessimistic result. Sketch the loop explicitly.
-
Assign sign conventions and datums. Dimensions that open the gap get a positive sign; dimensions that close it get negative. Establish a consistent datum reference frame per ASME Y14.5 so every contributor is measured from the same reference.
-
Collect inputs. For each contributor in the loop, you need: nominal dimension, bilateral tolerance (or upper/lower limits), GD&T callout if applicable, and process capability data (Cpk, Ppk) from your shop or supplier. Missing capability data forces you toward worst-case or conservative RSS.
-
Choose your analysis method. Apply the decision criteria from the previous section. When in doubt, run worst-case first to check feasibility, then RSS or Monte Carlo to evaluate whether tolerances can be relaxed.
-
Calculate and interpret. Compute the predicted gap range, compare it to your functional limits, and determine whether the design passes. If it fails, identify the top contributors before changing any tolerance.
-
Run sensitivity analysis. Rank contributors by their share of total variance. Tighten only the dimensions that materially affect the result.
-
Document and version-control the stack-up. Record inputs, assumptions, method, and results. Any dimensional change to a contributing feature requires a re-run.
Required inputs checklist:
- Nominal dimensions for every contributor in the loop
- Bilateral tolerances or upper/lower limit pairs
- GD&T callouts and datum reference frames
- Process capability data (Cpk/Ppk) per feature or process
- Assembly sequence and mating surface assumptions
- Functional requirement limits (min/max acceptable gap or interference)
Illustration note: an exploded-view sketch showing the stack loop path, with each contributor labeled and signed, dramatically reduces errors in both setup and review. Include one in your analysis documentation.
Common pitfalls:
- Using reference dimensions from the drawing (they carry no tolerance and shouldn't be in the loop)
- Selecting datums that don't match the actual assembly locating scheme
- Ignoring process capability and applying RSS to an unstable process
- Forgetting to re-run the analysis after a design change that affects any loop contributor
Worked example: worst-case, RSS, and Monte Carlo for a simple gap
Consider a four-part linear assembly where the functional requirement is a gap G that must stay between 0.005" and 0.045". Three spacers and a housing bore define the stack.
Input values
| Contributor | Nominal (in) | Tolerance (±in) | Variance (T²) |
|---|---|---|---|
| Housing bore depth | — | ±0.010 | 0.000100 |
| Spacer A length | 0.500 | ±0.005 | 0.000025 |
| Spacer B length | 0.750 | ±0.008 | 0.000064 |
| Spacer C length | 0.500 | ±0.006 | 0.000036 |
| Nominal gap | 0.250 |
Worst-case calculation
T_WC = 0.010 + 0.005 + 0.008 + 0.006 = ±0.029"
Predicted gap range: 0.250 − 0.029 = 0.221" to 0.250 + 0.029 = 0.279"
Wait — that's the total assembly dimension range, not the gap. Let's restate correctly: the nominal gap is 0.250 − (0.500 + 0.750 + 0.500) = 0.250". The worst-case gap range is 0.250 ± 0.029", giving 0.221" to 0.279". Both limits fall well outside the 0.005"–0.045" functional window, which means the nominal gap needs to be set closer to 0.025" with this tolerance budget. Adjust the nominal gap to 0.025": worst-case range becomes −0.004" to 0.054". That just barely fails at the low end.
RSS calculation
T_RSS = √(0.010² + 0.005² + 0.008² + 0.006²) = √(0.000100 + 0.000025 + 0.000064 + 0.000036) = √0.000225 = ±0.015"
With the nominal gap at 0.025": RSS range at 3σ is 0.010" to 0.040". Both limits now fall inside the 0.005"–0.045" window. The design passes at 3σ coverage (~99.73% of assemblies), assuming processes are capable.
Excel formula snippet:
=SQRT(SUMSQ(B2:B5)) ' where B2:B5 contain the individual tolerance values
Monte Carlo summary
Running 10,000 trials with each contributor sampled from a normal distribution (mean = nominal, σ = tolerance/3) produces a gap distribution centered at 0.025" with a standard deviation near 0.005". Approximately 0.3% of simulated assemblies fall outside the 0.005"–0.045" window, consistent with the 3σ RSS result. If any contributor's process is skewed or bimodal, Monte Carlo will show a shifted failure rate that RSS would miss entirely.
Monte Carlo setup in Excel/Google Sheets:
=NORMINV(RAND(), nominal, tolerance/3) ' one cell per contributor per trial row
Sum the contributors across each row, then count results outside your limits with COUNTIF.
Result comparison
| Method | Predicted gap range | Passes functional limits? | Implication |
|---|---|---|---|
| Worst-case | −0.004" to 0.054" | No (fails at low end) | Requires tighter tolerances or nominal adjustment |
| RSS (3σ) | 0.010" to 0.040" | Yes | Tolerances acceptable if Cpk ≥ 1.33 |
| Monte Carlo (10,000 trials) | ~0.3% out of spec | Yes (marginal) | Validates RSS; flags risk if distributions shift |
The RSS result allows tolerances roughly twice as wide as worst-case would require for the same functional outcome. That difference shows up directly in machining cost.
How to find which dimensions are actually driving your stack
Sensitivity analysis answers the question every engineer should ask before tightening anything: which contributor is actually responsible for the variation?

Percent contribution formula
For RSS, each contributor's share of total variance is:
%Contribution_i = (T_i²) / Σ(T_j²) × 100
Using the example above:
| Contributor | T² | % Contribution |
|---|---|---|
| Housing bore depth | 0.000100 | 44.4% |
| Spacer B length | 0.000064 | 44.4% |
| Spacer C length | 0.000036 | — |
| Spacer A length | 0.000025 | — |
The housing bore depth drives 44.4% of total RSS variance. A single component can drive over 76% of total RSS contribution in practical stacks, and this example shows the same pattern at a smaller scale: the top two contributors account for nearly 73% of variance between them.
What to do with this ranking
-
Tighten the top contributor first. Halving the housing bore tolerance from ±0.010" to ±0.005" cuts its variance contribution by 75%, dropping total RSS variation from ±0.015" to ±0.011". That's a meaningful improvement for one change.
-
Consider a design change before a tolerance change. If the housing bore depth is difficult to hold tightly, can the geometry be modified to remove it from the stack loop? A shoulder or snap ring that directly locates the spacer stack might eliminate the contributor entirely.
-
Add adjustability for dominant contributors. A shim or adjustable spacer at the highest-variance position lets you tune the gap at assembly rather than fighting it at the machining stage. This is often cheaper than tightening a tolerance by a factor of two.
-
Improve process control. If the housing bore Cpk is 1.0 and you need 1.33, a process improvement (better fixturing, tighter tool runout, updated cutting parameters) may be more cost-effective than redesigning the part.
The shift from "tighten everything" to "tighten the right thing" is where tolerance analysis pays for itself. Spending tolerance budget on a 11% contributor while ignoring the 44% contributor is a common and expensive mistake.
What tools should you use for tolerance stack-up analysis?
Spreadsheets, statistical packages, and dedicated tolerance tools each have a place depending on your workflow, team size, and analysis complexity.
Spreadsheets (Excel, Google Sheets) Fast to set up for simple linear stacks. The worked example formulas above run in any spreadsheet. The limitation is manual loop tracing, no built-in GD&T handling, and Monte Carlo that requires either add-ins or manual RAND() arrays. Downloadable starter spreadsheets and web calculators reduce setup time and common formula errors for engineers new to the method.
Statistical packages Tools like Minitab or R handle Monte Carlo robustly, support non-normal distributions, and produce publication-quality output. They're worth the learning curve for complex assemblies or when you need defensible statistical documentation for a customer or regulator.
Dedicated tolerance analysis tools Purpose-built tools visualize the stack loop, automate sensitivity ranking, import GD&T from CAD, and generate traceable reports. They reduce the manual work of loop tracing and sign-convention bookkeeping, which is where most spreadsheet errors originate.
Integrated machining platforms An integrated platform that combines tolerance calculation with process capability data, tooling records, and job documentation closes the gap between design analysis and shop execution. Availzyemachinistpro includes a tolerance calculator alongside feeds and speeds, tool deflection, surface finish, and other calculators in a single cloud-based environment. That means the process capability data you need to validate RSS assumptions lives in the same platform as the stack-up calculation itself.
Minimum capabilities checklist for any tolerance tool:
- Import or manual entry of nominal dimensions and tolerance bands
- Distribution selection (normal, uniform, skewed) for Monte Carlo
- GD&T callout handling or at least bilateral/unilateral tolerance input
- Sensitivity output showing percent contribution per contributor
- Exportable report with inputs, method, and results for change control
- Version tracking so re-runs after design changes are documented
Pro Tip: Before running RSS, pull your Cpk data from recent production runs for each contributing feature. If any contributor shows Cpk below 1.33, assign it a wider effective tolerance in your RSS model or switch to Monte Carlo with a non-normal distribution. Optimistic RSS results built on unverified capability data are one of the most common sources of assembly failures that "shouldn't have happened."
Shop-focused best practices and mistakes that cost you rework
The analysis is only as good as the inputs and the communication that surrounds it.
Datum selection and GD&T
Use the same datum reference frame in the stack-up that the shop will use to fixture and measure the part. A stack-up built on datum A-B-C that the machinist measures from a different surface is predicting a different assembly than the one being built. When handing off drawings, call out the functional datum explicitly and explain why it matters. A press fit tolerances guide that bridges design intent and manufacturing reality is worth sharing with your machining team for any interference-fit contributor in the stack.
First article inspection
After the first production run, measure every contributing dimension in the stack loop, not just the features that were flagged as tight. Calculate actual Cpk from the first-article data and compare it to the assumptions in your RSS model. If the numbers don't match, update the model before releasing the design for volume production. The first article inspection process is the right checkpoint to validate stack-up assumptions against real parts.
Communication with suppliers
When a supplier quotes a part, they price to the tolerance on the drawing. If your stack-up shows a particular feature is a low-sensitivity contributor, loosen that tolerance before the drawing goes out. Sending a drawing with ±0.002" on a feature that could be ±0.010" without affecting function costs you money on every part, every run. Encode the functional requirement in a note or a separate tolerance analysis document so the supplier understands what they're actually controlling.
Common mistakes to avoid
- Including reference dimensions in the stack loop. Reference dims carry no tolerance and add nothing except confusion.
- Using worst-case for high-volume, non-safety parts. If you're making 50,000 consumer enclosures and all processes are capable, worst-case analysis will price you out of the market.
- Ignoring process capability. RSS without Cpk verification is optimistic fiction.
- Never re-running the analysis. A design change to any contributing dimension invalidates the previous result. Stack-ups need version control the same way drawings do.
- Treating the stack-up as a one-time deliverable. It's a living document that should be updated through ECOs, supplier changes, and process improvements.
Which method fits your situation? A quick decision guide
Match your scenario to the right method before you start calculating.
Use worst-case when:
- The assembly is safety-critical and a single failure is unacceptable (aerospace fastener joints, medical implant interfaces, pressure-boundary seals)
- Volume is low enough that 100% fit is achievable without prohibitive cost
- Process capability data is unavailable and you can't verify RSS assumptions
- The stack has very few contributors (two or three), making worst-case and RSS results nearly identical anyway
Use RSS when:
- Production volume is high and statistical yield is an acceptable metric
- All contributing processes have verified Cpk ≥ 1.33
- Distributions are reasonably normal (confirmed by process data)
- The cost difference between worst-case and RSS tolerances is material to the part price
Use Monte Carlo when:
- The assembly has non-linear or 3D geometric relationships that don't reduce to a simple linear sum
- One or more contributors have non-normal distributions (skewed processes, bilateral tolerances with asymmetric capability)
- You need a probability-of-failure estimate rather than a coverage percentage
- The functional requirement is complex (e.g., angular clearance, surface contact area)
Scenario examples:
- Aerospace hydraulic fitting: Low volume, safety-critical, no tolerance for leakage. Worst-case. No exceptions.
- High-volume consumer electronics enclosure: 100,000 units, stable injection molding, Cpk consistently above 1.5. RSS at 3σ, with Monte Carlo to validate if any contributor's distribution looks skewed.
- Complex gearbox bearing preload: Multiple angular and linear contributors, thermal expansion effects, non-normal bearing race distributions. Monte Carlo with 10,000+ trials and empirical distributions from supplier capability studies.
Design review checklist:
- Functional requirement defined with numeric limits
- Stack loop traced and sketched
- All contributors identified with nominal and tolerance
- Process capability data collected or conservatively assumed
- Method selected and justified
- Sensitivity analysis run and top contributors identified
- Stack-up documented and version-controlled
Key Takeaways
Worst-case guarantees fit for every unit but drives up cost; RSS with verified Cpk ≥ 1.33 typically allows significantly wider tolerances for the same functional outcome; and sensitivity analysis should always precede any tolerance tightening decision.
| Point | Details |
|---|---|
| Choose the right method first | Use worst-case for safety-critical parts, RSS when Cpk ≥ 1.33 is confirmed, and Monte Carlo for complex or non-normal assemblies. |
| Sensitivity analysis before tightening | A single contributor can drive over 76% of total RSS variance; tighten only the top contributors, not every dimension in the loop. |
| Validate process capability | RSS assumptions fail if Cpk is below 1.33; always verify capability data before relying on statistical results for production sign-off. |
| Document and re-run | Any dimensional change to a contributing feature requires a new stack-up run; treat the analysis as a version-controlled document, not a one-time deliverable. |
| Availzyemachinistpro for integrated analysis | Availzyemachinistpro's tolerance calculator, combined with process capability data and tooling records in one platform, maps directly to the step-by-step workflow in this guide. |
The case for doing tolerance analysis earlier than you think
The conventional wisdom is that tolerance stack-up is something you do when a design is nearly finished, to confirm it will work before releasing drawings. That framing gets it backwards.
Analysis done at the concept stage, when geometry is still flexible, gives you the most leverage. You can eliminate contributors from the stack loop by changing how parts locate. You can choose a datum scheme that aligns with the shop's fixturing capability rather than fighting it later. You can identify which features need tight tolerances before a supplier has already quoted the job at a price that assumes loose ones.
What most teams underestimate is the operational cost of late-stage tolerance discovery. A stack-up failure found during first article inspection means rework, re-quoting, and schedule impact. The same failure found at the sketch stage means a geometry change that takes an afternoon. The math is the same either way. The timing is everything.
There's also a communication gap that stack-up analysis closes when it's done early and shared. When engineering hands off a drawing with a sensitivity-ranked tolerance analysis attached, the machinist and supplier know exactly which dimensions are functional and which have room to breathe. That context changes how a shop plans its setup, which cuts are prioritized for tight control, and how inspection resources are allocated. A drawing without that context gets treated as a uniform set of requirements, and every tolerance gets held to the same standard regardless of its actual contribution to function.
The shops that build this analysis into their design review process, not as a final check but as an iterative tool, consistently see fewer first-article failures and lower per-part costs on tight-tolerance work. The tolerance calculator is the starting point; the discipline of running it early is what actually changes outcomes.
Availzyemachinistpro puts tolerance analysis where you actually work
Spreadsheets work for simple stacks, but they don't connect to your process capability data, your tooling records, or your job documentation. Every time you switch between tools, you introduce a transcription step where errors hide.

Availzyemachinistpro brings tolerance calculation, feeds and speeds, tool deflection, surface finish, and shop management into one cloud-based platform. The tolerance calculator handles worst-case and RSS math directly, and the platform's CAD viewer lets you visualize STEP files alongside your stack-up documentation without switching applications. Process capability data from your Tool Crib and job history stays in the same environment as your analysis, so validating RSS assumptions doesn't require hunting through separate spreadsheets or supplier emails.
The result is faster iterations, fewer prototype cycles, and stack-up documentation that travels with the job through change control. Start with a 7-day free trial at availzye-machinist-pro.com and run your next stack-up inside the same platform you use to run the job.
Useful sources and further reading
Authoritative references for tolerance stack-up analysis, GD&T standards, and statistical methods:
-
Tolerance Stack Analysis Methods — University of Washington / Boeing (Scholz): A thorough technical report covering worst-case, RSS, and advanced statistical tolerancing methods with derivations. The primary academic reference for understanding the mathematical foundations.
-
Tolerance Analysis — Wikipedia: A solid overview of tolerance analysis methods including 2D stacks, Monte Carlo simulation, and datum conversions, with links to further technical literature.
-
Tolerance Stack-Up Analysis — TolAnalysis.com: Practical guidance on RSS, Monte Carlo sample sizes, and σ coverage conventions, with worked examples and calculator resources.
-
Understanding Tolerance Stack-Up Analysis — Minitab Blog: Accessible explanation of worst-case vs. statistical approaches, with clear discussion of when Monte Carlo is the right choice for complex assemblies.
-
Tolerance Stack-Up Analysis: Methods, Examples & Free Tools — RD8 Tech: Practical tutorials with downloadable spreadsheets and web calculators for engineers building their first stack-up workflows.
-
Tolerance Stackup Best Practices and Sensitivity Analysis — TolStackup.com: Focused guidance on sensitivity analysis and contributor prioritization, including the finding that a single component can drive over 76% of total RSS variance.
-
Tolerance Stack-Up Analysis: Worst-Case vs. RSS — Ficient Design: Clear explanation of stack loop tracing and the practical difference between worst-case and RSS results, with emphasis on avoiding non-contributing dimensions.
-
Engineering Software for Students: 2026 Essential Guide — Jewlz Technologies: A useful reference for engineers evaluating software tools for tolerance analysis and other engineering calculations, covering entry-level and professional options.
-
ASME Y14.5 (Dimensioning and Tolerancing): The governing U.S. standard for GD&T. Any stack-up analysis involving geometric tolerances must reference the applicable revision for correct interpretation of datum reference frames, feature control frames, and tolerance zone definitions. Available through ASME.org.