
Job profitability analysis is the process of comparing a project's revenue against every direct and indirect cost tied to it, including labor, materials, subcontractors, and applied overhead, to produce a job-level profit or loss statement. The result tells you whether a specific job made money after every expense is counted, not just whether the business as a whole looks healthy. Tools like Availzye Machinist Pro pull real-time shop data into that calculation so the answer reflects what actually happened on the floor.
TL;DR:
- Set cost codes before work begins, then log labor, materials, subcontractors, and equipment by job; recognize only signed change orders as revenue.
- Review active jobs weekly or biweekly, reconcile jobs lasting over 30 days weekly, and align month end reporting with the accounting close.
- Allocate overhead by actual resource use when jobs differ in setup or inspection needs; one flat rate can understate costs for complex work.
- Track gross, contribution, and job margin separately; weak job margin despite healthy gross margin usually signals overhead allocation, not poor direct cost control.
Table of Contents
- What job profitability analysis is and why it matters
- Core components to include in a job profitability report
- Step-by-step workflow from budget to reconciliation
- Allocating overhead: predetermined rates versus activity-based costing
- Interpreting results: key metrics and what they reveal
- Data, tools, and automation that make job reports reliable
- Best practices and common pitfalls to keep reports accurate
- Role of tool life and maintenance costs in profitability calculations
- Examples of typical cost drivers specific to CNC machining jobs
- Customizing profitability reports for different shop roles
- Why job-level clarity matters
- How Availzye Machinist Pro supports job profitability analysis
- FAQ
- Sources
What job profitability analysis is and why it matters
A job-level profit and loss statement isolates one project the way a company-wide income statement isolates a reporting period. It answers a narrower but sharper question: did this specific job, for this specific customer, generate a margin worth the effort it took to complete. Owners, project managers, and accounting staff all read the same report differently. An owner looks for which jobs to chase more of; a project manager looks for where labor hours ran over; an accountant checks that revenue recognition and cost allocation line up with the general ledger.
The report earns its keep when it is run on a schedule, not just at closeout. Useful checkpoints include:
- At major milestones, when a large batch of labor or materials has posted and early signals of margin fade are easiest to catch.
- During weekly or biweekly reviews on active jobs, so a manager can redirect labor or renegotiate scope before a loss compounds.
- At month-end, aligned with the accounting close, so job-level numbers reconcile to company-wide financials.
Run consistently, this cadence supports three decisions that matter more than the report itself. Pricing: jobs that consistently underperform tell you your estimates are off for that type of work. Stop-loss: a job bleeding margin partway through is easier to renegotiate or exit early than to absorb at closeout. Resource reallocation: if one job is overstaffed relative to its budget while another is behind schedule, the report shows where to move people before the gap widens. None of these decisions are visible from a single company-wide P&L, which is exactly why job-level reporting exists as its own discipline rather than a side effect of regular bookkeeping.
Core components to include in a job profitability report
A job report is only as reliable as the lines feeding it. Leaving out a cost category, or lumping dissimilar costs together, produces a margin number that looks precise but is not. A job profitability report is a job-level income statement that captures revenue, change orders, and all expenses for a single project, and every one of the following lines belongs in it.
- Revenue, including original contract billings, approved change orders recorded as they're signed, and a clear policy for how retainage is treated until it's released.
- Direct labor, calculated as hours worked multiplied by a fully loaded rate that includes wages, payroll taxes, and benefits, not just the base hourly wage.
- Direct materials, tied to the job through purchase orders and invoices rather than estimated after the fact.
- Subcontractor costs, matched to the job as invoices are approved, including any back charges or credits.
- Equipment and tooling charges, allocated by actual usage on the job rather than averaged across the shop.
- Applied overhead and other indirect costs, absorbed into the job using a consistent, documented rate.
Total job cost is the sum of direct materials, direct labor, and applied overhead, and skipping the overhead line is one of the most common ways a job looks more profitable on paper than it actually is. Revenue lines deserve the same discipline as cost lines. A change order that is verbally agreed but not yet signed should not appear as revenue, and retainage withheld by a customer should be tracked separately from cash collected so the report doesn't overstate what has actually been realized. On the cost side, the biggest distortions tend to come from timing: a subcontractor invoice that arrives a month after the work was performed, or a bulk material purchase that covers three jobs but gets coded to just one. Building a chart of cost codes before the job starts, and holding the team to using them consistently, prevents most of these problems before they happen. For shops working through the math on loaded labor and equipment rates, a practical breakdown of machining cost estimation walks through the formulas in more detail.
Step-by-step workflow from budget to reconciliation
Running a job profitability analysis is a sequence, not a single calculation. Skipping a step, especially the reconciliation at the end, is how shops end up with job reports that don't match the books.
- Build the job budget and cost codes before work begins. Break the job into phases or cost codes (labor, materials, subcontractors, equipment) so every dollar that comes in later has a home. Job costing requires the accounting system to allow job numbers on expenses and revenues, and setting that structure up front is what makes later variance tracking possible at all.
- Capture labor, purchase orders, invoices, and subcontractor charges in real time. The longer a cost sits uncoded, the more likely it gets lumped into the wrong job or missed entirely. Timecards tied to job numbers, POs logged at the time of purchase, and invoices coded on receipt all feed this step.
- Apply overhead and compute total job cost. Use your predetermined overhead rate (or activity-based drivers, covered in the next section) to add indirect costs to the direct costs already captured.
- Calculate job margin and compare it to budget. Subtract total job cost from job revenue to get the dollar margin, then divide by revenue for the margin percentage. Compare both figures against the original budget to see where the job is tracking ahead or behind.
- Reconcile to the general ledger and document approved change orders. Accurate job reports depend on reconciling job-level data to the general ledger and making sure only approved change orders, not verbal agreements, are reflected in revenue.
For jobs that run long, don't wait for the final step to catch a problem. Phase-level mini-budgets on long jobs let you spot a margin fade in week three instead of discovering it at closeout, when there's no time left to correct course.
Pro Tip: Run the reconciliation step weekly on active jobs over 30 days, even if the full report is only shared with leadership monthly.
The sequence matters because each step depends on the one before it. A budget built without proper cost codes makes real-time capture meaningless, since there's nowhere accurate to log the costs. Real-time capture that never gets reconciled to the ledger produces a job report that drifts further from reality every month. And overhead applied inconsistently, say, one rate this quarter and a different one next quarter without documentation, makes it impossible to compare margins across jobs at all. Treat the five steps as a loop that repeats every reporting period, not a one-time setup.
Allocating overhead: predetermined rates versus activity-based costing
Direct costs are the easy part of job costing. Indirect costs, like rent, utilities, supervision, and shop equipment depreciation, are harder because they don't naturally attach to one job. Two methods handle this differently.
A predetermined overhead rate is calculated once per period (often annually) by dividing estimated total overhead by an estimated activity base, such as direct labor hours or machine hours. Predetermined overhead rates are commonly used to absorb indirect costs into job costs, and the appeal is simplicity: one rate, applied consistently, with minimal recalculation.
Activity-based costing (ABC) allocates overhead based on actual resource consumption rather than a single volume measure. ABC is especially useful when jobs consume overhead differently from one another, such as a job requiring extensive tool setup and quality inspection versus a simple repeat-run job that needs neither.
- A predetermined rate is faster to apply and works well when jobs are similar in how they use shop resources.
- ABC takes more setup but surfaces hidden costs, like setup time or inspection labor, that a single rate spreads evenly across jobs regardless of whether they actually used those resources.
- Many shops default to a single overhead rate out of convenience, which is exactly what distorts job costs when jobs don't consume overhead the same way.
A worked comparison: say a shop has $50,000 in monthly overhead and 2,000 total machine hours. The predetermined rate is $25 per machine hour, applied flat to every job. A complex job using 40 machine hours but requiring extensive tool changeovers and inspection would be charged $1,000 in overhead under the flat rate. Under ABC, if that job's share of setup and inspection activity is double the shop average, its allocated overhead might run closer to $1,600, a more accurate reflection of what it actually cost to run.
Choosing a driver: machine hours work well for machining-intensive shops, while labor hours fit labor-heavy operations better. Revisit the driver and the rate at least annually, and sooner if your mix of job types changes significantly. For a deeper walkthrough of the rate calculation itself, see this overhead rate calculation guide for shop owners.
Interpreting results: key metrics and what they reveal
A job margin percentage alone doesn't tell you much without context. A handful of related metrics round out the picture.
- Gross margin is revenue minus direct costs (labor, materials, subcontractors), divided by revenue; it shows how efficiently the job used direct resources before overhead is factored in.
- Job margin is revenue minus total job cost (direct costs plus applied overhead), divided by revenue; this is the number closest to the job's true bottom line.
- Contribution margin is revenue minus variable costs only, useful for judging whether a job covers its own variable costs and contributes toward fixed overhead.
- Profitability analysis pairs financial ratios with operational context like timecard timing and subcontractor schedules, which is what turns a raw margin number into a decision a manager can act on.
What counts as a healthy margin depends heavily on your trade, job size, and risk level, so benchmark against your own historical jobs of similar type before comparing to any external figure. A red flag worth investigating immediately is a job tracking more than a few points below its budgeted margin at the halfway mark, particularly when labor hours are the driver. The corrective action usually starts with a labor audit: are the hours being logged to the right job, and is the crew size still matched to what the budget assumed. A second common red flag is a job with healthy gross margin but weak job margin, which usually points to an overhead rate that doesn't fit that type of work, a signal to revisit your allocation method rather than the job itself.
Data, tools, and automation that make job reports reliable
Accurate job reports depend on how fast and how completely cost data reaches the report, not just on the formulas used once it's there. A few categories of shop and accounting tools make the biggest difference.
- Real-time capture of timecards, purchase orders, invoices, and job status through a job tracker closes the gap between when a cost happens and when it's reflected in the report.
- Tool crib inventory and maintenance logs tie tooling consumption and machine downtime directly to the jobs that caused them, instead of spreading those costs evenly across everything the shop runs.
- A cost estimator built on the same loaded labor and machine rates used in actual job costing keeps quoted jobs and completed jobs comparable, rather than estimating with one set of assumptions and reporting with another.
- An AI assistant can speed up the estimating step by applying consistent loaded rates and reference data across quotes, reducing the chance that two similar jobs get priced on different assumptions.
Real-time dashboards give decision-makers visibility into operational data as it changes, rather than after a reporting cycle closes, which is the same principle that makes job-level cost capture valuable on the shop floor.
Pro Tip: Keep your estimator's loaded rate and your job tracker's loaded rate in sync. The moment they diverge, your quoted margin and your actual margin stop being comparable.
Features like a cost estimator and a job tracker built on the same underlying rate data illustrate how closing that gap looks in practice.
Best practices and common pitfalls to keep reports accurate
Reliable job reports come from process discipline more than from any single tool.
- Establish cost-code discipline. Set up codes before the job starts and require the team to use them for every timecard, PO, and invoice.
- Enter data close to when it happens. Costs logged days or weeks late are far more likely to land on the wrong job.
- Reconcile to the general ledger regularly, not just at year-end, so job-level numbers and company financials never drift apart.
- Use phase budgets and weekly variance reviews on long jobs so a fading margin is caught while there's still time to act.
Two of the most common practical errors are misallocating bulk purchases to a single job when the materials actually served several jobs, and applying one broad overhead rate across jobs that consume shop resources very differently. Both are fixable: split bulk purchases by actual usage at the time of allocation, and revisit your overhead method if your job mix includes both simple and resource-intensive work. Financial controls and regular review matter at the project level the same way they matter for the business overall.
Role of tool life and maintenance costs in profitability calculations
Tool wear and machine downtime are direct, job-specific costs, even though they often get buried in general overhead instead of charged to the job that caused them. A job that runs a cutter near the end of its service life, or that triggers an unplanned maintenance call, carries real costs beyond the labor and material lines on the estimate.
Tracking tool life against the jobs that consumed it lets you charge tooling wear to the job responsible for it rather than spreading it evenly across everything the shop produces that month. The same logic applies to maintenance: a machine that goes down mid-job for an avoidable reason, like a tool that should have been swapped earlier, adds cost and lost time that belongs in that job's report, not in a general maintenance budget disconnected from any specific project.
Shops that fold tool crib and maintenance log data into job costing catch a category of cost that otherwise shows up as unexplained overhead. A job that looks profitable on labor and materials alone can turn marginal once its share of tooling wear and unplanned downtime is added in, which is exactly the kind of gap a job-level report is supposed to close. Logging tool life at check-out and check-in, rather than estimating it after the fact, is what makes this allocation accurate instead of a guess.
Examples of typical cost drivers specific to CNC machining jobs
Machining jobs carry cost drivers that don't show up the same way in other project-based trades. Recognizing them is part of building an accurate job budget in the first place.
Machine hours are often the clearest driver, since cycle time, setup time, and changeovers all consume machine capacity that has a real cost per hour. Tooling consumption, including inserts, end mills, and specialty tooling, scales with material hardness and part complexity rather than with labor hours, which is why a labor-only overhead rate tends to understate the cost of tool-intensive jobs. Material scrap and rework, particularly on tight-tolerance parts, adds direct material cost that a simple per-part estimate can miss if scrap rates aren't tracked by job.

Setup and changeover time is another driver that varies widely between a long production run and a one-off prototype, even when both use similar machine hours overall. Quality inspection, especially on parts requiring certified measurement or first-article inspection, adds labor that belongs to the job that required it, not to general overhead. Taken together, these drivers are a large part of why a predetermined overhead rate applied uniformly across jobs can misrepresent machining-heavy work specifically, and why activity-based allocation tends to fit CNC shops better than a single blended rate.
Customizing profitability reports for different shop roles
The same underlying job data serves different people differently, and a report built for one role rarely satisfies another without adjustment.
Shop owners and managers generally want a summary view: job margin against budget, a short list of jobs trending off track, and enough detail to decide where to intervene without wading through every line item. Engineers and estimators benefit more from a breakdown by cost driver, machine hours, tooling, setup time, since that's the level of detail that improves the next estimate rather than just explaining the last job. Machinists and shop floor leads are usually best served by a narrower view tied to their own jobs: hours logged against budget and any flags on parts or tooling, without the full financial report that isn't actionable at their level.
Role-based access to the underlying data, rather than three separate spreadsheets maintained by hand, is what keeps these views consistent with each other. When an engineer's driver-level detail and an owner's summary margin come from the same dataset, there's no risk of the two telling a different story about the same job.
Why job-level clarity matters
A company-wide P&L can look healthy while individual jobs quietly lose money, and that gap is where most margin erosion hides. We've seen the pattern play out the same way more than once: a shop assumes a job type is profitable because the trade has always worked that way, until a job-level report shows tooling and setup costs eating a margin that looked fine on the estimate. The fix is rarely dramatic, usually a driver change or tighter cost-code discipline, but it only happens once someone looks at the job on its own. Run the report before you trust the assumption.
— Availzye
How Availzye Machinist Pro supports job profitability analysis
We built Availzye Machinist Pro around the idea that a job report is only as good as the data feeding it, so we put the capture and the calculation in the same place instead of spreading them across spreadsheets, paper logs, and separate software.
- Our job tracker logs work orders and status changes as they happen, so labor and progress data reach your job costing without a manual re-entry step.
- Our cost estimator uses the same loaded rate assumptions you'll reconcile against later, keeping quoted and actual margins comparable.
- Our tool crib logs tool life and check-in and check-out activity by job, so tooling wear gets charged to the job that caused it.
- Our AI assistant helps apply consistent rates and reference data across estimates, cutting down on the rate drift that distorts margin comparisons between jobs.
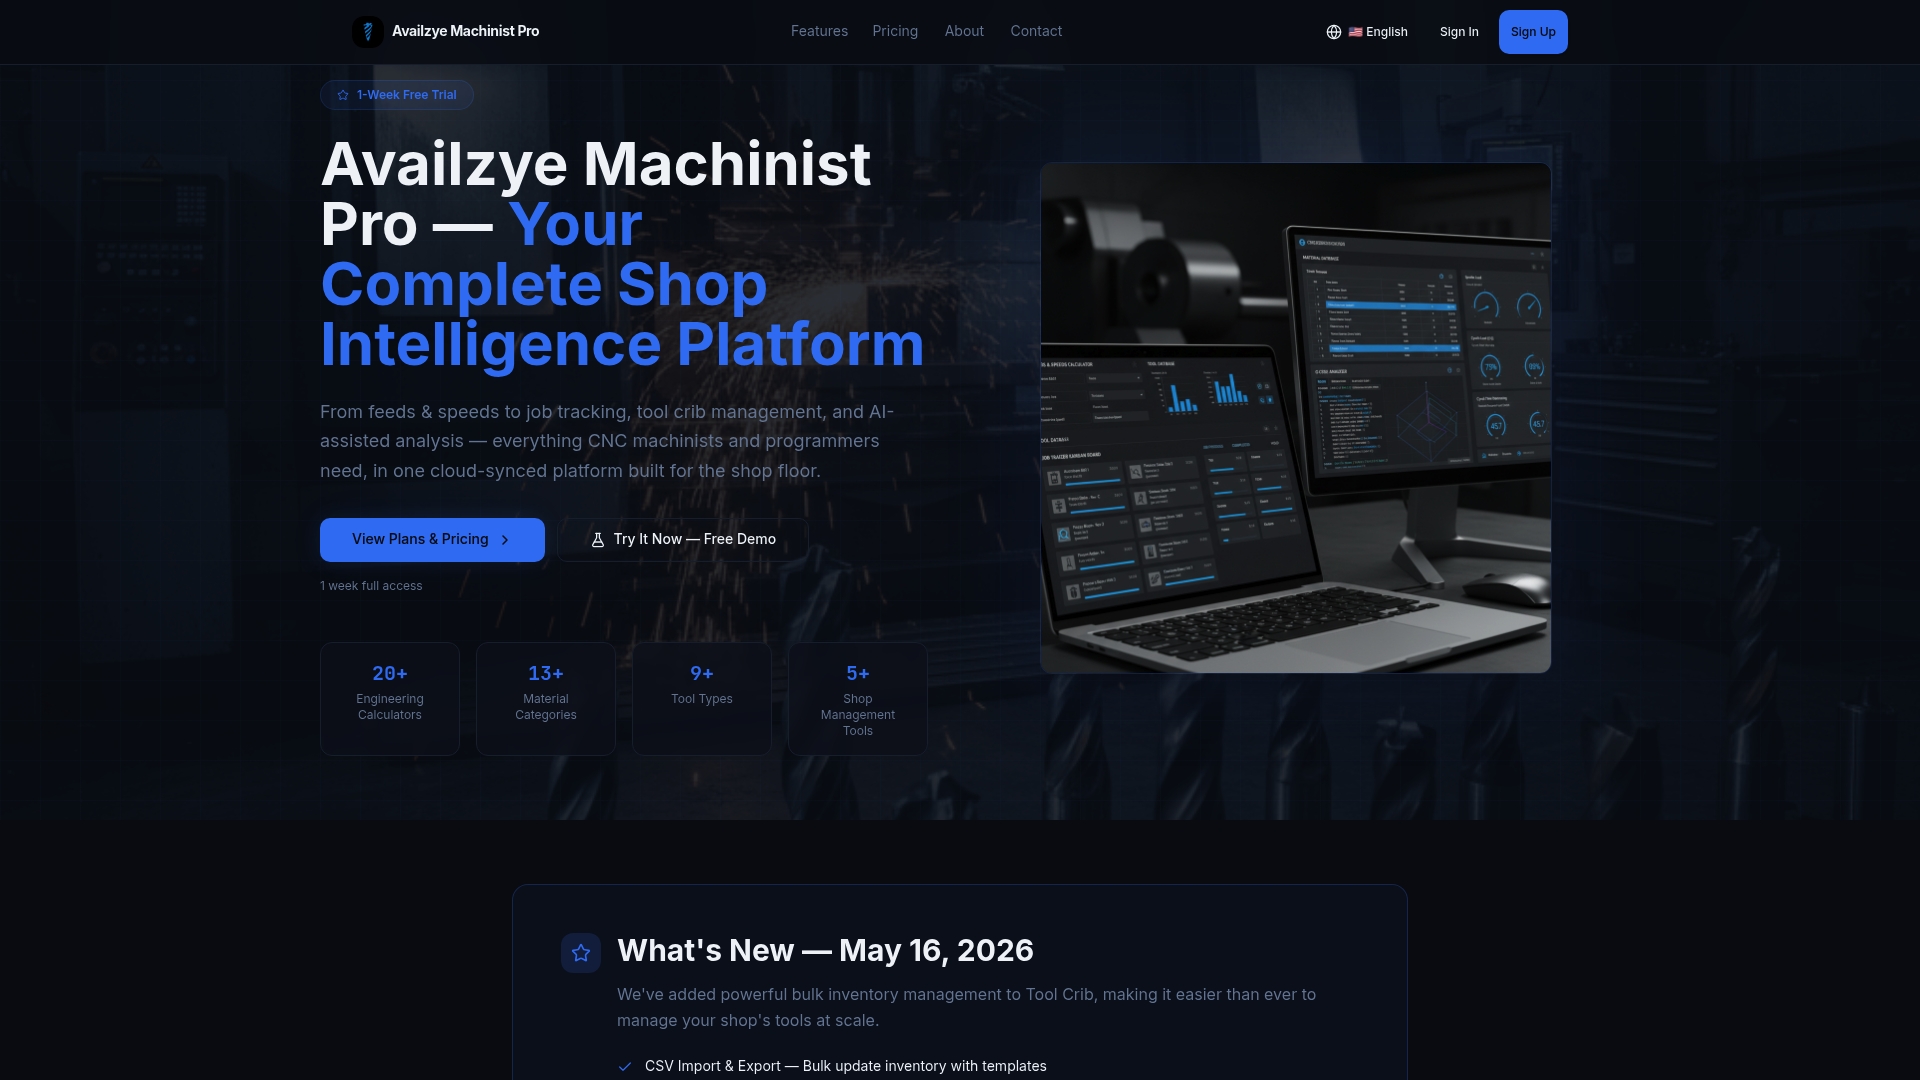
We offer three subscription tiers, each including a 7-day free trial. Current prices are available on our pricing page. If you want to see how job tracking, estimating, and tool crib data come together in one report, start a free trial at Availzye Machinist Pro and run it against your next job.
FAQ
What are the five profitability ratios?
Commonly cited profitability ratios include gross margin, operating margin, net margin, return on assets (ROA), and return on equity (ROE). These ratios are typically paired with operational context rather than read in isolation, since a strong ratio on paper can still hide weak performance in a specific job or segment.
What is a good profit margin per job?
A healthy job margin depends heavily on your trade, job size, and risk profile, so there's no single number that applies across different types of work. The more reliable approach is benchmarking a job against your own historical jobs of similar scope rather than an external target.
Is a 20% profit margin considered healthy for a business?
Comparing margin trends across your own jobs over time is generally more useful than judging a single percentage against an outside benchmark.
How do you perform a profitability analysis?
A profitability analysis starts with building a job budget and cost codes, then capturing actual labor, materials, and subcontractor costs as they occur, applying overhead, and calculating margin against the budget. The final step is reconciling the job report to the general ledger and confirming only approved change orders are reflected in revenue.
Sources
- Job Profitability Reports: Turning Data into Strategic Decisions | Procore
- 6 methods of cost accounting | JMCO
- Profitability analysis: A step-by-step guide | Ramp
- Activity-based costing | Workday